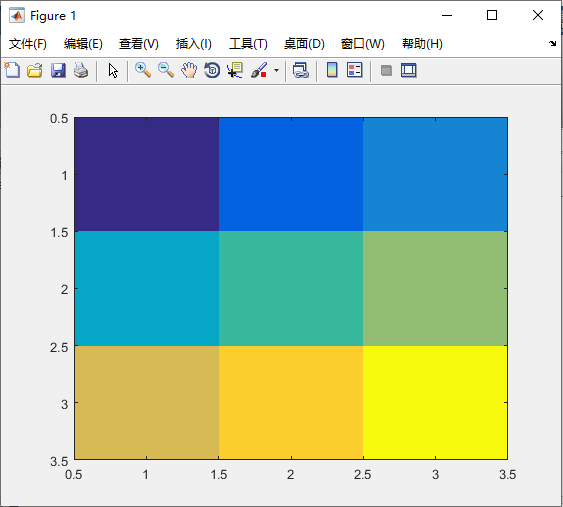
1、使用imagesc函数,绘制出彩色矩阵块
matrix_data = [1,2,3;4,5,6;7,8,9];
imagesc(matrix_data);
2、原文链接
别人写的matrixplot函数
function matrixplot(data,varargin)
%   根据实值矩阵绘制色块图,用丰富的颜色和形状形象的展示矩阵元素值的大小。
%
%   matrixplot(data) 绘制矩阵色块图,data为实值矩阵,每一个元素对应一个色块,色
%                    块颜色由元素值大小决定。
%
%   matrixplot(data, 'PARAM1',val1, 'PARAM2',val2, ...)
%          用成对出现的参数名/参数值控制色块的各项属性。可用的参数名/参数值如下:
%          'FigShape' --- 设定色块的形状,其参数值为:
%                'Square'  --- 方形(默认)
%                'Circle'  --- 圆形
%                'Ellipse' --- 椭圆形
%                'Hexagon' --- 六边形
%                'Dial'    --- 表盘形
%
%          'FigSize' --- 设定色块的大小,其参数值为:
%                'Full'    --- 最大色块(默认)
%                'Auto'    --- 根据矩阵元素值自动确定色块大小
%
%          'FigStyle' --- 设定矩阵图样式,其参数值为:
%                'Auto'    --- 矩形矩阵图(默认)
%                'Tril'    --- 下三角矩阵图
%                'Triu'    --- 上三角矩阵图
%
%          'FillStyle' --- 设定色块填充样式,其参数值为:
%                'Fill'    --- 填充色块内部(默认)
%                'NoFill'  --- 不填充色块内部
%
%          'DisplayOpt' --- 设定是否在色块中显示矩阵元素值,其参数值为:
%                'On'      --- 显示矩阵元素值(默认)
%                'Off'     --- 不显示矩阵元素值
%
%          'TextColor' --- 设定文字的颜色,其参数值为:
%                表示单色的字符('r','g','b','y','m','c','w','k'),默认为黑色
%                1行3列的红、绿、蓝三元色灰度值向量([r,g,b])
%                'Auto'    --- 根据矩阵元素值自动确定文字颜色
%
%          'XVarNames' --- 设定X轴方向需要显示的变量名(默认为X1,X2,...),其参数值为:
%                字符串矩阵或字符串元胞数组,若为字符串矩阵,其行数应与data的列数相同
%                若为字符串元胞数组,其长度应与data的列数相同。
%
%          'YVarNames' --- 设定Y轴方向需要显示的变量名(默认为Y1,Y2,...),其参数值为:
%                字符串矩阵或字符串元胞数组,若为字符串矩阵,其行数应与data的行数相同
%                若为字符串元胞数组,其长度应与data的行数相同。
%
%          'ColorBar' --- 设定是否显示颜色条,其参数值为:
%                'On'      --- 显示颜色条
%                'Off'     --- 不显示颜色条(默认)
%
%          'Grid' --- 设定是否显示网格线,其参数值为:
%                'On'      --- 显示网格线(默认)
%                'Off'     --- 不显示网格线
%
%   Example:
%   x = [1,-0.2,0.3,0.8,-0.5
%        -0.2,1,0.6,-0.7,0.2
%         0.3,0.6,1,0.5,-0.3
%         0.8,-0.7,0.5,1,0.7
%        -0.5,0.2,-0.3,0.7,1];
%   matrixplot(x);
%   matrixplot(x,'DisplayOpt','off');
%   matrixplot(x,'FillStyle','nofill','TextColor','Auto');
%   matrixplot(x,'TextColor',[0.7,0.7,0.7],'FigShap','s','FigSize','Auto','ColorBar','on');
%   matrixplot(x,'TextColor','k','FigShap','d','FigSize','Full','ColorBar','on','FigStyle','Triu');
%   XVarNames = {'xiezhh','heping','keda','tust','tianjin'};
%   matrixplot(x,'FigShap','e','FigSize','Auto','ColorBar','on','XVarNames',XVarNames,'YVarNames',XVarNames);
% 对第一个输入参数类型进行判断
if ~ismatrix(data) || ~isreal(data)
    error('输入参数类型不匹配:第一个输入参数应为实值矩阵');
end

% 解析成对出现的参数名/参数值
[FigShape,FigSize,FigStyle,FillStyle,DisplayOpt,TextColor,XVarNames,...
    YVarNames,ColorBar,GridOpt] = parseInputs(varargin{:});

% 产生网格数据
[m,n] = size(data);
[x,y] = meshgrid(0:n,0:m);
data = data(:);
maxdata = nanmax(data);
mindata = nanmin(data);
rangedata = maxdata - mindata;
if isnan(rangedata)
    warning('MATLAB:warning1','请检查您输入的矩阵是否合适!');
    return;
end
z = zeros(size(x))+0.2;
sx = x(1:end-1,1:end-1)+0.5;
sy = y(1:end-1,1:end-1)+0.5;

if strncmpi(FigStyle,'Tril',4)
    z(triu(ones(size(z)),2)>0) = NaN;
    sx(triu(ones(size(sx)),1)>0) = NaN;
elseif strncmpi(FigStyle,'Triu',4)
    z(tril(ones(size(z)),-2)>0) = NaN;
    sx(tril(ones(size(sx)),-1)>0) = NaN;
end
sx = sx(:);
sy = sy(:);
id = isnan(sx) | isnan(data);
sx(id) = [];
sy(id) = [];
data(id) = [];

if isempty(XVarNames)
    XVarNames = strcat('X',cellstr(num2str((1:n)')));
else
    if (iscell(XVarNames) && (numel(XVarNames) ~= n)) || (~iscell(XVarNames) && (size(XVarNames,1) ~= n))
        error('X轴方向变量名应为字符串矩阵或字符串元胞数组,其长度与输入矩阵的列数相同');
    end
end
if isempty(YVarNames)
    YVarNames = strcat('Y',cellstr(num2str((1:m)')));
else
    if (iscell(YVarNames) && (numel(YVarNames) ~= m)) || (~iscell(YVarNames) && (size(YVarNames,1) ~= m))
        error('Y轴方向变量名应为字符串矩阵或字符串元胞数组,其长度与输入矩阵的行数相同');
    end
end

% 绘图
figure('color','w',...
    'units','normalized',...
    'pos',[0.289165,0.154948,0.409956,0.68099]);
axes('units','normalized','pos',[0.1,0.022,0.89,0.85]);
if strncmpi(GridOpt,'On',2)
    mesh(x,y,z,...
        'EdgeColor',[0.7,0.7,0.7],...
        'FaceAlpha',0,...
        'LineWidth',1);   % 参考网格线
end
hold on;
axis equal;
axis([-0.1,n+0.1,-0.1,m+0.1,-0.5,0.5]);
view(2);
% 设置X轴和Y轴刻度位置及标签
set(gca,'Xtick',(1:n)-0.5,...
    'XtickLabel',XVarNames,...
    'Ytick',(1:m)-0.5,...
    'YtickLabel',YVarNames,...
    'XAxisLocation','top',...
    'YDir','reverse',...
    'Xcolor',[0.7,0.7,0.7],...
    'Ycolor',[0.7,0.7,0.7],...
    'TickLength',[0,0]);
axis off

% 绘制填充色块
if strncmpi(FillStyle,'Fill',3)
    MyPatch(sx',sy',data',FigShape,FigSize);
end

% 显示数值文本信息
if strncmpi(DisplayOpt,'On',2)
    str = num2str(data,'%4.2f');
    scale = 0.1*max(n/m,1)/(max(m,n)^0.55);
    if strncmpi(TextColor,'Auto',3)
        ColorMat = get(gcf,'ColorMap');
        nc = size(ColorMat,1);
        cid = fix(mapminmax(data',0,1)*nc)+1;
        cid(cid<1) = 1;
        cid(cid>nc) = nc;
        TextColor = ColorMat(cid,:);
        for i = 1:numel(data)
            text(sx(i),sy(i),0.1,str(i,:),...
                'FontUnits','normalized',...
                'FontSize',scale,...
                'fontweight','bold',...
                'HorizontalAlignment','center',...
                'Color',TextColor(i,:));
        end
    else
        text(sx,sy,0.1*ones(size(sx)),str,...
            'FontUnits','normalized',...
            'FontSize',scale,...
            'fontweight','bold',...
            'HorizontalAlignment','center',...
            'Color',TextColor);
    end
end

% 设置X轴和Y轴刻度标签的缩进方式
MyTickLabel(gca,FigStyle);

% 添加颜色条
if strncmpi(ColorBar,'On',2)
    if any(strncmpi(FigStyle,{'Auto','Triu'},4))
        colorbar('Location','EastOutside');
    else
        colorbar('Location','SouthOutside');
    end
end
end

% ---------------------------------------------------
%  调整坐标轴刻度标签子函数
% ---------------------------------------------------
function MyTickLabel(ha,tag)

%   根据显示范围自动调整坐标轴刻度标签的函数
%   ha   坐标系句柄值
%   tag  调整坐标轴刻度标签的标识字符串,可用取值如下:
%        'Auto' --- 将x轴刻度标签旋转90度,y轴刻度标签不作调整
%        'Tril' --- 将x轴刻度标签旋转90度,并依次缩进,y轴刻度标签不作调整
%        'Triu' --- 将x轴刻度标签旋转90度,y轴刻度标签依次缩进
%   Example:
%   MyTickLabel(gca,'Tril');
if ~ishandle(ha)
    warning('MATLAB:warning2','第一个输入参数应为坐标系句柄');
    return;
end

if ~strcmpi(get(ha,'type'),'axes')
    warning('MATLAB:warning3','第一个输入参数应为坐标系句柄');
    return;
end
axes(ha);
xstr = get(ha,'XTickLabel');
xtick = get(ha,'XTick');
xl = xlim(ha);
ystr = get(ha,'YTickLabel');
ytick = get(ha,'YTick');
yl = ylim(ha);
set(ha,'XTickLabel',[],'YTickLabel',[]);
x = zeros(size(ytick)) + xl(1) - range(xl)/30;
y = zeros(size(xtick)) + yl(1) - range(yl)/70;
nx = numel(xtick);
ny = numel(ytick);

if strncmpi(tag,'Tril',4)
    y = y + (1:nx) - 1;
elseif strncmpi(tag,'Triu',4)
    x = x + (1:ny) - 1;
end

text(xtick,y,xstr,...
    'rotation',90,...
    'Interpreter','none',...
    'color','r',...
    'HorizontalAlignment','left');
text(x,ytick,ystr,...
    'Interpreter','none',...
    'color','r',...
    'HorizontalAlignment','right');
end

% ---------------------------------------------------
%  根据散点数据绘制3维色块图子函数
% ---------------------------------------------------
function  MyPatch(x,y,z,FigShape,FigSize)
%   根据散点数据绘制3维色块图
%   MyPatch(x,y,z,FigShape,FigSize)  x,y,z是实值数组,用来指定色块中心点三维
%          坐标。FigShape是字符串变量,用来指定色块形状。
%          FigSize是字符串变量,用来指定色块大小。
%
%   Example:
%         x = rand(10,1);
%         y = rand(10,1);
%         z = rand(10,1);
%         MyPatch(x,y,z,'s','Auto');
%

% 输入参数类型判断
if nargin < 3
    error('至少需要三个输入参数');
end
if ~isreal(x) || ~isreal(y) || ~isreal(z)
    error('前三个输入应为实值数组');
end
n = numel(z);
if numel(x) ~= n || numel(y) ~= n
    error('坐标应等长');
end
if strncmpi(FigSize,'Auto',3) && ~strncmpi(FigShape,'Ellipse',1)
    id = (z == 0);
    x(id) = [];
    y(id) = [];
    z(id) = [];
end
if isempty(z)
    return;
end
% 求色块顶点坐标
rab1 = ones(size(z));
maxz = max(abs(z));
if maxz == 0
    maxz = 1;
end
rab2 = abs(z)/maxz;
if strncmpi(FigShape,'Square',1)
    % 方形
    if strncmpi(FigSize,'Full',3)
        r = rab1;
    else
        r = sqrt(rab2);
    end
    SquareVertices(x,y,z,r);
elseif strncmpi(FigShape,'Circle',1)
    % 圆形
    if strncmpi(FigSize,'Full',3)
        r = 0.5*rab1;
    else
        r = 0.5*sqrt(rab2);
    end
    CircleVertices(x,y,z,r);
elseif strncmpi(FigShape,'Ellipse',1)
    % 椭圆形
    a = 0.48 + rab2*(0.57-0.48);
    b = (1-rab2).*a;
    EllipseVertices(x,y,z,a,b);
elseif strncmpi(FigShape,'Hexagon',1)
    % 六边形
    if strncmpi(FigSize,'Full',3)
        r = 0.5*rab1;
    else
        r = 0.5*sqrt(rab2);
    end
    HexagonVertices(x,y,z,r);
else
    % 表盘形
    if strncmpi(FigSize,'Full',3)
        r = 0.45*rab1;
    else
        r = 0.45*sqrt(rab2);
    end
    DialVertices(x,y,z,r);
end
end
%--------------------------------------------------
% 求色块顶点坐标并绘制色块的子函数
%--------------------------------------------------
function SquareVertices(x,y,z,r)
% 方形
hx = r/2;
hy = hx;
Xp = [x-hx;x-hx;x+hx;x+hx;x-hx];
Yp = [y-hy;y+hy;y+hy;y-hy;y-hy];
Zp = repmat(z,[5,1]);
patch(Xp,Yp,Zp,'FaceColor','flat','EdgeColor','flat');
end
function CircleVertices(x,y,z,r)
% 圆形
t = linspace(0,2*pi,30)';
m = numel(t);
Xp = repmat(x,[m,1])+cos(t)*r;
Yp = repmat(y,[m,1])+sin(t)*r;
Zp = repmat(z,[m,1]);
patch(Xp,Yp,Zp,'FaceColor','flat','EdgeColor','flat');
end
function EllipseVertices(x,y,z,a,b)
% 椭圆形
t = linspace(0,2*pi,30)';
m = numel(t);
t0 = -sign(z)*pi/4;
t0 = repmat(t0,[m,1]);
x0 = cos(t)*a;
y0 = sin(t)*b;
Xp = repmat(x,[m,1]) + x0.*cos(t0) - y0.*sin(t0);
Yp = repmat(y,[m,1]) + x0.*sin(t0) + y0.*cos(t0);
Zp = repmat(z,[m,1]);
patch(Xp,Yp,Zp,'FaceColor','flat','EdgeColor','flat');
end
function HexagonVertices(x,y,z,r)
% 六边形
t = linspace(0,2*pi,7)';
m = numel(t);
Xp = repmat(x,[m,1])+cos(t)*r;
Yp = repmat(y,[m,1])+sin(t)*r;
Zp = repmat(z,[m,1]);
patch(Xp,Yp,Zp,'FaceColor','flat','EdgeColor','flat');
end
function DialVertices(x,y,z,r)
% 表盘形
% 绘制表盘扇形
maxz = max(abs(z));
t0 = z*2*pi/maxz-pi/2;
t0 = cell2mat(arrayfun(@(x)linspace(-pi/2,x,30)',t0,'UniformOutput',0));
m = size(t0,1);
r0 = repmat(r,[m,1]);
Xp = [x;repmat(x,[m,1]) + r0.*cos(t0);x];
Yp = [y;repmat(y,[m,1]) + r0.*sin(t0);y];
Zp = repmat(z,[m+2,1]);
patch(Xp,Yp,Zp,'FaceColor','flat','EdgeColor',[0,0,0]);
% 绘制表盘圆周
t = linspace(0,2*pi,30)';
m = numel(t);
Xp = repmat(x,[m,1])+cos(t)*r;
Yp = repmat(y,[m,1])+sin(t)*r;
Zp = repmat(z,[m,1]);
Xp = [Xp;flipud(Xp)];
Yp = [Yp;flipud(Yp)];
Zp = [Zp;flipud(Zp)];
patch(Xp,Yp,Zp,'FaceColor','flat','EdgeColor',[0,0,0]);
end
%--------------------------------------------------------------------------
%  解析输入参数子函数1
%--------------------------------------------------------------------------
function [FigShape,FigSize,FigStyle,FillStyle,DisplayOpt,TextColor,...
    XVarNames,YVarNames,ColorBar,GridOpt] = parseInputs(varargin)
if mod(nargin,2)~=0
    error('输入参数个数不对,应为成对出现');
end
pnames = {'FigShape','FigSize','FigStyle','FillStyle','DisplayOpt',...
    'TextColor','XVarNames','YVarNames','ColorBar','Grid'};
dflts =  {'Square','Full','Auto','Fill','On','k','','','Off','On'};
[FigShape,FigSize,FigStyle,FillStyle,DisplayOpt,TextColor,XVarNames,...
    YVarNames,ColorBar,GridOpt] = parseArgs(pnames, dflts, varargin{:});
validateattributes(FigShape,{'char'},{'nonempty'},mfilename,'FigShape');
validateattributes(FigSize,{'char'},{'nonempty'},mfilename,'FigSize');
validateattributes(FigStyle,{'char'},{'nonempty'},mfilename,'FigStyle');
validateattributes(FillStyle,{'char'},{'nonempty'},mfilename,'FillStyle');
validateattributes(DisplayOpt,{'char'},{'nonempty'},mfilename,'DisplayOpt');
validateattributes(TextColor,{'char','numeric'},{'nonempty'},mfilename,'TextColor');
validateattributes(XVarNames,{'char','cell'},{},mfilename,'XVarNames');
validateattributes(YVarNames,{'char','cell'},{},mfilename,'YVarNames');
validateattributes(ColorBar,{'char'},{'nonempty'},mfilename,'ColorBar');
validateattributes(GridOpt,{'char'},{'nonempty'},mfilename,'Grid');
if ~any(strncmpi(FigShape,{'Square','Circle','Ellipse','Hexagon','Dial'},1))
    error('形状参数只能为Square, Circle, Ellipse, Hexagon, Dial 之一');
end
if ~any(strncmpi(FigSize,{'Full','Auto'},3))
    error('图形大小参数只能为Full, Auto 之一');
end
if ~any(strncmpi(FigStyle,{'Auto','Tril','Triu'},4))
    error('图形样式参数只能为Auto, Tril, Triu 之一');
end
if ~any(strncmpi(FillStyle,{'Fill','NoFill'},3))
    error('图形填充样式参数只能为Fill, NoFill 之一');
end
if ~any(strncmpi(DisplayOpt,{'On','Off'},2))
    error('显示数值参数只能为On,Off 之一');
end
if ~any(strncmpi(ColorBar,{'On','Off'},2))
    error('显示颜色条参数只能为On,Off 之一');
end
if ~any(strncmpi(GridOpt,{'On','Off'},2))
    error('显示网格参数只能为On,Off 之一');
end
end
%--------------------------------------------------------------------------
%  解析输入参数子函数2
%--------------------------------------------------------------------------
function [varargout] = parseArgs(pnames,dflts,varargin)
%   Copyright 2010-2011 The MathWorks, Inc.
%   $Revision: 1.1.6.2 $  $Date: 2011/05/09 01:27:26 $
% Initialize some variables
nparams = length(pnames);
varargout = dflts;
setflag = false(1,nparams);
unrecog = {};
nargs = length(varargin);
dosetflag = nargout>nparams;
dounrecog = nargout>(nparams+1);

% Must have name/value pairs
if mod(nargs,2)~=0
    m = message('stats:internal:parseArgs:WrongNumberArgs');
    throwAsCaller(MException(m.Identifier, '%s', getString(m)));
end

% Process name/value pairs
for j=1:2:nargs
    pname = varargin{j};
    if ~ischar(pname)
        m = message('stats:internal:parseArgs:IllegalParamName');
        throwAsCaller(MException(m.Identifier, '%s', getString(m)));
    end

    mask = strncmpi(pname,pnames,length(pname)); % look for partial match
    if ~any(mask)
        if dounrecog
            % if they've asked to get back unrecognized names/values, add this
            % one to the list
            unrecog((end+1):(end+2)) = {varargin{j} varargin{j+1}};
            continue
        else
            % otherwise, it's an error
            m = message('stats:internal:parseArgs:BadParamName',pname);
            throwAsCaller(MException(m.Identifier, '%s', getString(m)));
        end
    elseif sum(mask)>1
        mask = strcmpi(pname,pnames); % use exact match to resolve ambiguity
        if sum(mask)~=1
            m = message('stats:internal:parseArgs:AmbiguousParamName',pname);
            throwAsCaller(MException(m.Identifier, '%s', getString(m)));
        end
    end
    varargout{mask} = varargin{j+1};
    setflag(mask) = true;
end

% Return extra stuff if requested
if dosetflag
    varargout{nparams+1} = setflag;
    if dounrecog
        varargout{nparams+2} = unrecog;
    end
end
end