介绍
Prometheus开源系统监控和告警工具包。一个独立的开源项目,拥有非常活跃的开发人员和用户社区。
2016年加入了 Cloud Native Computing Foundation,这是继Kubernetes之后的第二个托管项目。
特征
- 多维度数据模型
- 灵活的查询语言
- 不依赖分布式存储,单个服务器节点自主
- 以HTTP方式,通过pull模型拉取时间序列数据
- 可以通过中间网关支持push模型
- 通过服务发现或者静态配置发现目标服务对象
- 支持多样图表和界面显示
TimeSeries Database
按照时间顺序记录系统状态变化的数据被称为时序数据。
- 性能好
- 关系型数据库对大规模数据的处理性能不足。
- NOSQL可以比较好的处理大规模数据,但依然比不上TimeSeries Data。
- 存储成本低
- 采样数据仅/个占用3.5byte(官网:上百万条时间序列,30秒间隔,保留60天,大概花了200多G)。
结构和组件

安装
服务器预置条件
- 确认时间同步:采集时间序列数据所以务必保证时间同步。
- 关闭防火墙:正式环境建议以暴露端口策略进行访问限制。(仅作体验)
- 关闭SELinux:防止权限和资源滥用的工具。(仅作体验)
从 https://prometheus.io/download/ 下载相应版本,使用官网提供的二进制版解压安装,无需编译。
# tar -xzvf prometheus-x.x.x.linux- amd64.tar.gz -C /usr/local/
# mv /usr/local/prometheus-x.x.x.linux- amd64/ /usr/local/prometheus
# nohup /usr/local/prometheus/prometheus -- config.file="/usr/local/prometheus/prometheus.yml" &
# lsof -i:9090
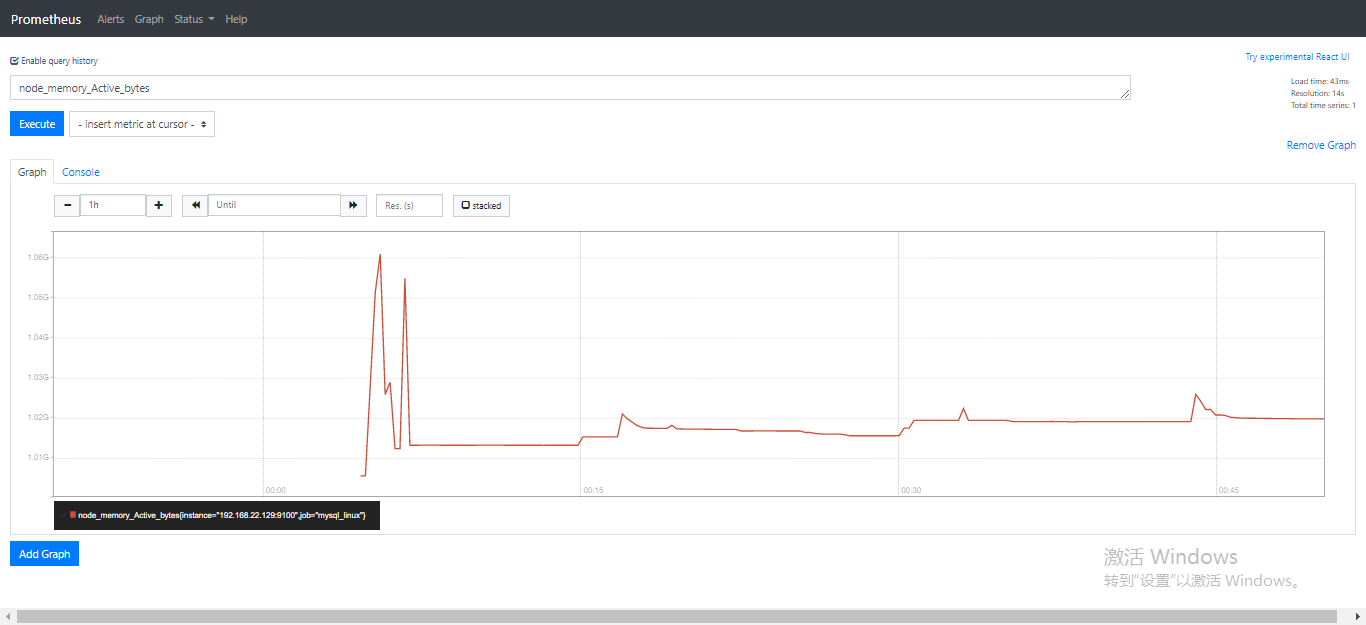
一般查询监控指标项的步骤
- 访问http://Prometheus服务器地址:9090 (进入主界面默认访问graph页面);
- 在查询输入框输入监控指标Expression(模糊查询);
- 选中指定指标后点击Execute按钮查询收集到的监控数据;
- 点击Graph展示该数据图形;
- 访问http://Prometheus服务器地址:9090/metrics可以查看到监控数据;
实例:服务器/服务
监控Linux服务器
-
在远程linux服务器上安装node_exporter组件(https://prometheus.io/download/#node_exporter);
# tar xf node_exporter-1.0.1.linux-amd64.tar.gz -C /usr/local/ # mv /usr/local/node_exporter-1.0.1.linux-amd64 /usr/local/node_exporter # nohup /usr/local/node_exporter/node_exporter & # lsof -i:9100 -
访问http://被监控服务器IP:9100/metrics查看node_exporter在收集的监控信息;
-
prometheus配置文件添加被监控服务器信息;
-
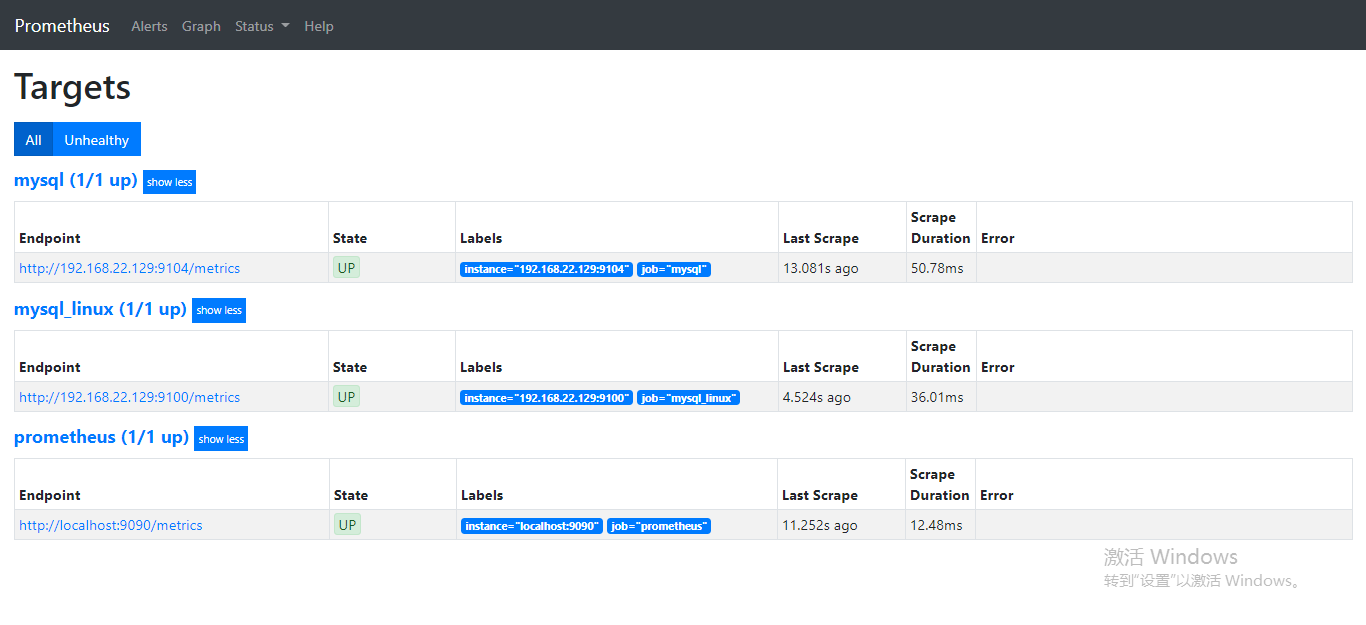
检查prometheus管理控制台Status->Targets下是否新增监控目标;
监控Mysql性能
步骤同Linux服务器,组件:mysqld_exporter
配置文件
	# my global config
	global:
	  scrape_interval:     15s # Set the scrape interval to every 15 seconds. Default is every 1 minute.
	  evaluation_interval: 15s # Evaluate rules every 15 seconds. The default is every 1 minute.
	  # scrape_timeout is set to the global default (10s).
	# Alertmanager configuration
	alerting:
	  alertmanagers:
	  - static_configs:
	    - targets:
	      # - alertmanager:9093
	# Load rules once and periodically evaluate them according to the global 'evaluation_interval'.
	rule_files:
	  # - "first_rules.yml"
	  # - "second_rules.yml"
	# A scrape configuration containing exactly one endpoint to scrape:
	# Here it's Prometheus itself.
	scrape_configs:
	  # The job name is added as a label `job=<job_name>` to any timeseries scraped from this config.
	  - job_name: 'prometheus'
	    # metrics_path defaults to '/metrics'
	    # scheme defaults to 'http'.
	    static_configs:
	    - targets: ['localhost:9090']
	  - job_name: 'mysql_linux'
	    # metrics_path defaults to '/metrics'
	    # scheme defaults to 'http'.
	    static_configs:
	    - targets: ['192.168.22.129:9100']
	  - job_name: 'mysql'
	    # metrics_path defaults to '/metrics'
	    # scheme defaults to 'http'.
	    static_configs:
	    - targets: ['192.168.22.129:9104']
监控目标