用matplotlib.pyplot的subplots命令可以很方便的画对称的子图,但是如果要画非对称的子图(如下)就需要用GridSpec命令来控制子图的位置和大小:
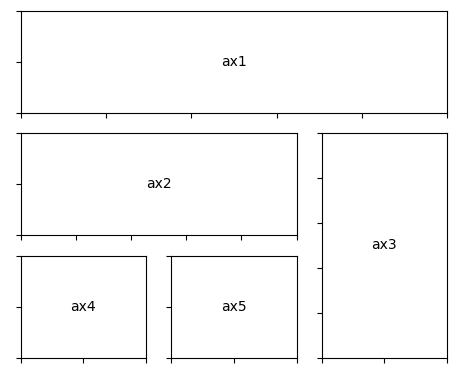
而上图的结构可以用一下两种方式画:
import matplotlib.pyplot as plt
from matplotlib.gridspec import GridSpec

fig = plt.figure(1)
gs = GridSpec(3, 3)

ax1 = plt.subplot(gs[0, :])
ax2 = plt.subplot(gs[1, :2])
ax3 = plt.subplot(gs[1:, 2])
ax4 = plt.subplot(gs[2, 0])
ax5 = plt.subplot(gs[2, 1])
或者
ax1 = plt.subplot2grid((3, 3), (0, 0), colspan=3)
ax2 = plt.subplot2grid((3, 3), (1, 0), colspan=2)
ax3 = plt.subplot2grid((3 ,3), (1, 2), rowspan=2)
ax4 = plt.subplot2grid((3, 3), (2, 0))
ax5 = plt.subplot2grid((3, 3), (2, 1))
更多间隔设置可以参考gridspec的官方文档。
PS:如果是读取图片作为子图的话建议用Pillow包的Image函数读取,而非自带的imread函数,对图像的调整会方便很多:
ax1 = fig.add_subplot(gs[:, 0])
img = Image.open("your image")
ax1.imshow(img)