画图与图例:
legend(x, y = NULL, legend, fill = NULL, col = par("col"),
border = "black", lty, lwd, pch,
angle = 45, density = NULL, bty = "o", bg = par("bg"),
box.lwd = par("lwd"), box.lty = par("lty"), box.col = par("fg"),
pt.bg = NA, cex = 1, pt.cex = cex, pt.lwd = lwd,
xjust = 0, yjust = 1, x.intersp = 1, y.intersp = 1,
adj = c(0, 0.5), text.width = NULL, text.col = par("col"),
text.font = NULL, merge = do.lines && has.pch, trace = FALSE,
plot = TRUE, ncol = 1, horiz = FALSE, title = NULL,
inset = 0, xpd, title.col = text.col, title.adj = 0.5,
seg.len = 2)
|
x, y |
X,y用于定位图例,也可用单键词"bottomright", "bottom", "bottomleft", "left", "topleft", "top", "topright", "right" and "center" |
|
legend |
字符或表达式向量 |
|
fill |
用特定的颜色进行填充 |
|
col |
图例中出现的点或线的颜色 |
|
border |
当fill = 参数存在的情况下,填充色的边框 |
|
lty, lwd |
图例中线的类型与宽度 |
|
pch |
点的类型 |
|
angle |
阴影的角度 |
|
density |
阴影线的密度 |
|
bty |
图例框是否画出,o为画出,默认为n不画出 |
|
bg |
bty != "n"时,图例的背景色 |
|
box.lty, box.lwd, box.col |
bty = "o"时,图例框的类型,box.lty决定是否为虚线,box.lwd决定粗线,box.col决定颜色 |
|
pt.bg |
点的背景色 |
|
cex |
字符大小 |
|
pt.cex |
点的大小 |
|
pt.lwd |
点的边缘的线宽 |
|
x.intersp |
图例中文字离图片的水平距离 |
|
y.intersp |
图例中文字离图片的垂直距离 |
|
adj |
图例中字体的相对位置 |
|
text.width |
图例字体所占的宽度 |
|
text.col |
图例字体的颜色 |
|
text.font |
图例字体 |
|
merge |
logical, if TRUE,合并点与线,但不填充图例框,默认为TRUE |
|
trace |
logical; if TRUE显示图例信息. |
|
plot |
logical. If FALSE不画出图例 |
|
ncol |
图例中分类的列数 |
|
horiz |
logical; if TRUE,水平放置图例 |
|
title |
给图例加标题 |
|
inset |
当图例用关键词设置位置后,inset = 分数,可以设置其相对位置 |
|
xpd |
xpd=FALSE,即不允许在作图区域外作图,改为TRUE即可,与par()参数配合使用。 |
|
title.col |
标题颜色 |
|
title.adj |
图例标题的相对位置,0.5为默认,在中间。0最左,1为最右。 |
|
seg.len |
lty 与lwd的线长,长度单位为字符宽度 |
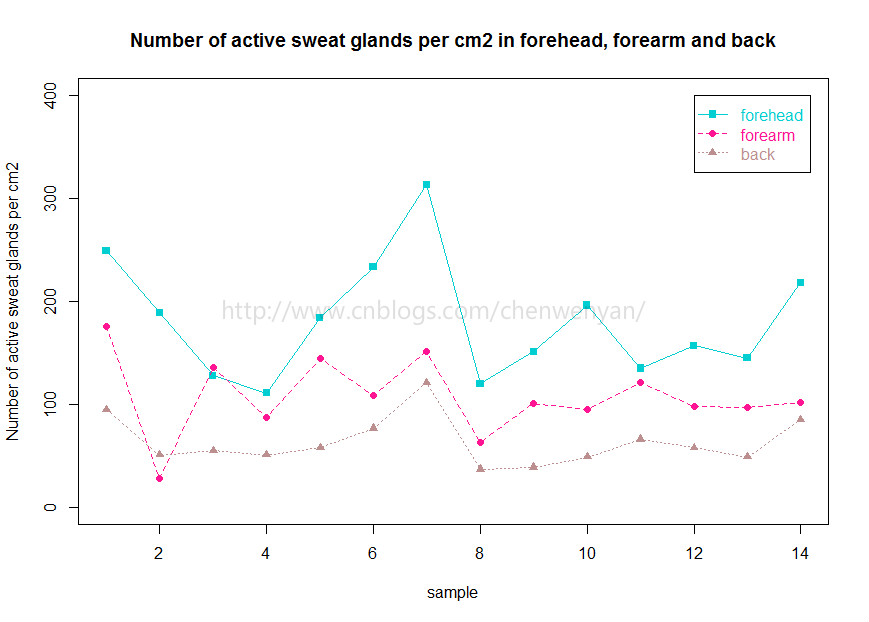
接着画出每个样本forearm位置的sweat gland 数量
注意,这里不用plot函数画forearm和sample之间的关系,因为会把上面forehead和sample的图覆盖住,为了实现多个因变量和一个自变量在同一个图片里,我们要用points或者lines函数画其他因变量和自变量的值
|
1
|
points(sample,forearm,pch=16,col="DeepPink",cex=1)#cex表示散点的大小 |
画出back位置的sweat gland 数量
|
1
|
points(sample,back,pch=17,col="RosyBrown",cex=1) |
把14个样本在forehead,forearm和back不同位置的sweat gland 数量用线连起来
|
1
2
3
|
lines(forehead,col="DarkTurquoise",lty=1)#lty=1表示用实线连起来lines(forearm,col="DeepPink",lty=2)#lty=2表示用虚线连起来lines(back,col="RosyBrown",lty=3)#lty=3表示用点线连起来 |
legend函数,图例说明:
|
1
|
legend(12,400,c("forehead","forearm","back"),col=c("DarkTurquoise","DeepPink","RosyBrown"),text.col=c("DarkTurquoise","DeepPink","RosyBrown"),pch=c(15,16,17),lty=c(1,2,3))#12表示x轴坐标为12,400表示y轴坐标为400,意思为图例的左边和上边界限,text.col表示图例文本颜色 |
最后,画出来的图片效果如下: