

  1 # coding: utf-8
  2
  3 # In[1]:
  4
  5
  6 import urllib.request
  7 import os
  8
  9
 10 # In[2]:
 11
 12
 13 url="http://biostat.mc.vanderbilt.edu/wiki/pub/Main/DataSets/titanic3.xls"
 14 filepath="titanic3.xls"
 15 if not os.path.isfile(filepath):
 16     result=urllib.request.urlretrieve(url,filepath)
 17     print('downloaded:',result)
 18
 19
 20 # In[3]:
 21
 22
 23 import numpy
 24 import pandas as pd
 25
 26
 27 # In[4]:
 28
 29
 30 all_df = pd.read_excel(filepath)
 31
 32
 33 # In[5]:
 34
 35
 36 all_df[:5]
 37
 38
 39 # In[6]:
 40
 41
 42 cols=['survived','name','pclass' ,'sex', 'age', 'sibsp',
 43       'parch', 'fare', 'embarked']
 44 all_df=all_df[cols]
 45 all_df[:5]
 46
 47
 48 # In[7]:
 49
 50
 51 all_df.isnull().sum()
 52
 53
 54 # In[8]:
 55
 56
 57 df=all_df.drop(['name'], axis=1)
 58 df[:20]
 59
 60
 61 # In[9]:
 62
 63
 64 age_mean = df['age'].mean()
 65 df['age'] = df['age'].fillna(age_mean)
 66 df[:20]
 67
 68
 69 # In[10]:
 70
 71
 72 fare_mean = df['fare'].mean()
 73 df['fare'] = df['fare'].fillna(fare_mean)
 74
 75
 76 # In[11]:
 77
 78
 79 df['sex']= df['sex'].map({'female':0, 'male': 1}).astype(int)
 80
 81
 82 # In[12]:
 83
 84
 85 df[:2]
 86
 87
 88 # In[13]:
 89
 90
 91 x_OneHot_df = pd.get_dummies(data=df,columns=["embarked" ])
 92
 93
 94 # In[14]:
 95
 96
 97 x_OneHot_df[:2]
 98
 99
100 # In[15]:
101
102
103 ndarray = x_OneHot_df.values
104 ndarray.shape
105
106
107 # In[16]:
108
109
110 ndarray[:2]
111
112
113 # In[17]:
114
115
116 Label = ndarray[:,0]
117 Features = ndarray[:,1:]
118
119
120 # In[18]:
121
122
123 Features[:2]
124
125
126 # In[19]:
127
128
129 from sklearn import preprocessing
130 minmax_scale = preprocessing.MinMaxScaler(feature_range=(0, 1))
131 scaledFeatures=minmax_scale.fit_transform(Features)
132 scaledFeatures[:2]
133
134
135 # In[20]:
136
137
138 msk = numpy.random.rand(len(all_df)) < 0.8
139 train_df = all_df[msk]
140 test_df = all_df[~msk]
141
142
143 # In[21]:
144
145
146 msk
147
148
149 # In[22]:
150
151
152 print('total:',len(all_df),
153       'train:',len(train_df),
154       'test:',len(test_df))
155
156
157 # In[23]:
158
159
160 def PreprocessData(raw_df):
161     df=raw_df.drop(['name'], axis=1)
162     age_mean = df['age'].mean()
163     df['age'] = df['age'].fillna(age_mean)
164     fare_mean = df['fare'].mean()
165     df['fare'] = df['fare'].fillna(fare_mean)
166     df['sex']= df['sex'].map({'female':0, 'male': 1}).astype(int)
167     x_OneHot_df = pd.get_dummies(data=df,columns=["embarked" ])
168
169     ndarray = x_OneHot_df.values
170     Features = ndarray[:,1:]
171     Label = ndarray[:,0]
172
173     minmax_scale = preprocessing.MinMaxScaler(feature_range=(0, 1))
174     scaledFeatures=minmax_scale.fit_transform(Features)
175
176     return scaledFeatures,Label
177
178
179 # In[24]:
180
181
182 train_Features,train_Label=PreprocessData(train_df)
183 test_Features,test_Label=PreprocessData(test_df)
184
185
186 # In[25]:
187
188
189 train_Features[:2]
190
191
192 # In[26]:
193
194
195 train_Label[:2]
196
197
198 # In[27]:
199
200
201 from keras.models import Sequential
202 from keras.layers import Dense,Dropout
203
204
205 # In[28]:
206
207
208 model = Sequential()
209 model.add(Dense(units=40, input_dim=9,
210                 kernel_initializer='uniform',
211                 activation='relu'))
212 model.add(Dense(units=30,
213                 kernel_initializer='uniform',
214                 activation='relu'))
215 model.add(Dense(units=1,
216                 kernel_initializer='uniform',
217                 activation='sigmoid'))
218 model.summary()
219
220
221 # In[29]:
222
223
224 model.compile(loss='binary_crossentropy',
225               optimizer='adam', metrics=['accuracy'])
226 train_history =model.fit(x=train_Features,
227                          y=train_Label,
228                          validation_split=0.1,
229                          epochs=30,
230                          batch_size=30,verbose=2)
231
232
233 # In[30]:
234
235
236 import matplotlib.pyplot as plt
237 def show_train_history(train_history,train,validation):
238     plt.plot(train_history.history[train])
239     plt.plot(train_history.history[validation])
240     plt.title('Train History')
241     plt.ylabel(train)
242     plt.xlabel('Epoch')
243     plt.legend(['train', 'validation'], loc='upper left')
244     plt.show()
245 show_train_history(train_history,'acc','val_acc')
246 show_train_history(train_history,'loss','val_loss')
247
248
249 # In[31]:
250
251
252 scores = model.evaluate(x=test_Features,
253                         y=test_Label)
254 scores
255
256
257 # In[32]:
258
259
260 Jack = pd.Series([0 ,'Jack',3, 'male'  , 23, 1, 0,  5.0000,'S'])
261 Rose = pd.Series([1 ,'Rose',1, 'female', 20, 1, 0, 100.0000,'S'])
262 JR_df = pd.DataFrame([list(Jack),list(Rose)],
263                   columns=['survived', 'name','pclass', 'sex',
264                    'age', 'sibsp','parch', 'fare','embarked'])
265 all_df=pd.concat([all_df,JR_df])
266 all_df[-2:]
267
268
269 # In[33]:
270
271
272 all_Features,Label=PreprocessData(all_df)
273 all_probability=model.predict(all_Features)
274 all_probability[:10]
275
276
277 # In[34]:
278
279
280 pd=all_df
281 pd.insert(len(all_df.columns),
282           'probability',all_probability)
283 pd[-2:]
284
285
286 # In[35]:
287
288
289 pd[(pd['survived']==0) &  (pd['probability']>0.9) ]
290
291
292 # In[36]:
293
294
295 pd[:5]
296
297
298 # In[ ]:
299
300
301
302
303
304 # In[ ]:
excel资源如下:
链接:https://pan.baidu.com/s/1PvonynplLKC6ZepSlL9DqQ
提取码:w7z3
采用多层感知器的方案的,主要是特点是针对数据的预处理过程。对excel表格的处理。
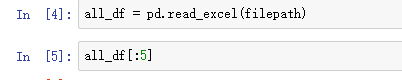
读取文件显示前五行:
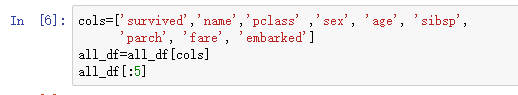
筛选出表内的指定列:
去掉名字列生成新数据:

查找未知信息null,然后补充为平均值


修改性别样式从male和female到0和1:

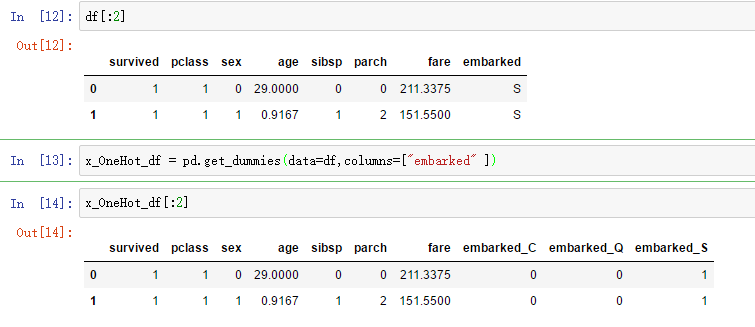
将DF中的数据某列拆分:
提取目标输出数据和输入数据:

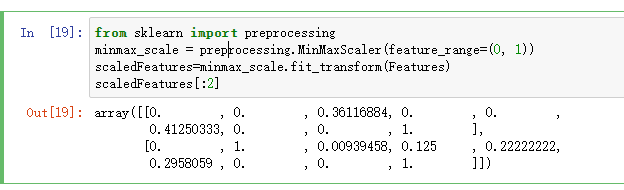
将输入数据转化为0-1之间的数据方式:
随机分割数据2:8作为测试数据和训练数据的方案!:

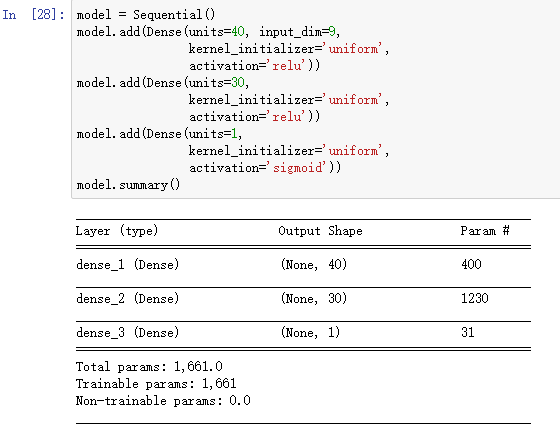
之后建立模型,两个隐层,计算方式为上一层神经元乘下一层神经元,加偏差下一层神经元。
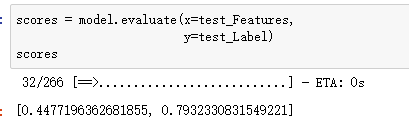
之后计算,绘图,预测。
插入两行数据到总数据:

之后计算预测,找到生存概率。


筛选出实际数据为0而预测数据为存活的数据:
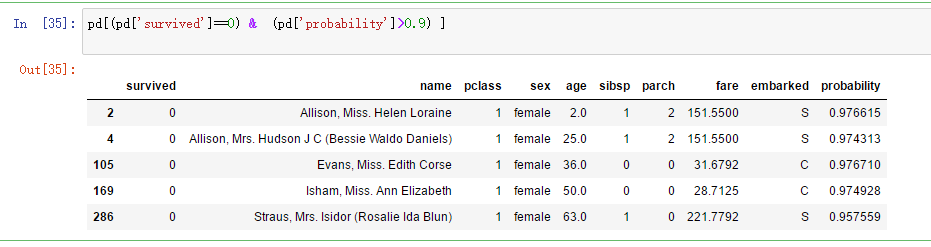
可以找到他们之所以没有存活的背后感人故事。。。。。。