高级滤波:
 1 from skimage import data,color,data_dir
 2 import matplotlib.pyplot as plt
 3 from skimage.morphology import disk
 4 import skimage.filters.rank as sfr
 5 img =color.rgb2gray(data.camera())
 6 auto =sfr.autolevel(img, disk(5))  #半径为5的圆形滤波器
 7 plt.figure('filters',figsize=(8,8))
 8 plt.subplot(121)
 9 plt.imshow(img,plt.cm.gray)
10 plt.subplot(122)
11 plt.imshow(auto,plt.cm.gray)
12 data_dir
高级滤波.....
 1 from skimage import data,color
 2 import matplotlib.pyplot as plt
 3 from skimage.morphology import disk
 4 import skimage.filters.rank as sfr
 5 img =color.rgb2gray(data.camera())
 6 auto =sfr.bottomhat(img, disk(5))  #半径为5的圆形滤波器
 7 auto1 =sfr.tophat(img, disk(5))  #半径为5的圆形滤波器
 8 plt.figure('filters',figsize=(12,12))
 9 plt.subplot(131)
10 plt.imshow(img,plt.cm.gray)
11 plt.subplot(132)
12 plt.imshow(auto,plt.cm.gray)
13 plt.subplot(133)
14 plt.imshow(auto1,plt.cm.gray)
提取轮廓....
 1 import numpy as np
 2 import matplotlib.pyplot as plt
 3 from skimage import measure,draw,data,filters
 4 #生成二值测试图像
 5 img=data.page()
 6 thresh = filters.threshold_isodata(img)
 7 img1 = (img <= thresh)*1.0   #根据阈值进行分割
 8 #检测所有图形的轮廓
 9 img2 = img1[:,:]
10 contours = measure.find_contours(img1, 0.5)
11 #绘制轮廓
12 fig, (ax0,ax1,ax2) = plt.subplots(1,3,figsize=(15,15))
13 ax0.imshow(img,plt.cm.gray)
14 ax1.imshow(img1,plt.cm.gray)
15 ax2.imshow(img2,plt.cm.gray)    #enumerate索引序列
16 for n, contour in enumerate(contours):
17     ax2.plot(contour[:, 1], contour[:, 0], linewidth=1)
18 plt.show()
提取轮廓..............
 1 import matplotlib.pyplot as plt
 2 from skimage import measure,data,color
 3 img=color.rgb2gray(data.horse())
 4 contours = measure.find_contours(img, 0.5)
 5 fig, axes = plt.subplots(1,2,figsize=(8,8))
 6 ax0, ax1= axes.ravel()
 7 ax0.imshow(img,plt.cm.gray)
 8 rows,cols=img.shape
 9 ax1.axis([0,rows,cols,0])
10 for n, contour in enumerate(contours):
11     ax1.plot(contour[:, 1], contour[:, 0], linewidth=1)
12 ax1.axis('image')
13 plt.show()
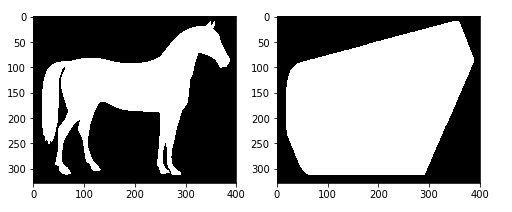
凸包............
import matplotlib.pyplot as plt
from skimage import data,color,morphology
img=color.rgb2gray(data.horse())
img=(img<0.5)*1
chull = morphology.convex_hull_image(img)
fig, axes = plt.subplots(1,2,figsize=(8,8))
ax0, ax1= axes.ravel()
ax0.imshow(img,plt.cm.gray)
ax1.imshow(chull,plt.cm.gray)
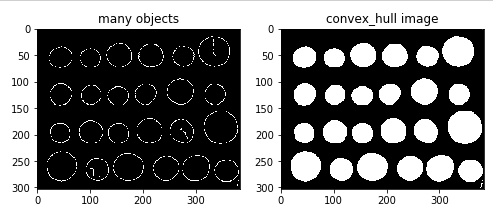
多个凸包.....................................................................................
 1 import matplotlib.pyplot as plt
 2 from skimage import data,color,morphology,feature
 3 img=color.rgb2gray(data.coins())
 4 edgs=feature.canny(img, sigma=3, low_threshold=10, high_threshold=50)
 5 chull = morphology.convex_hull_object(edgs)
 6
 7 #绘制轮廓
 8 fig, axes = plt.subplots(1,2,figsize=(8,8))
 9 ax0, ax1= axes.ravel()
10 ax0.imshow(edgs,plt.cm.gray)
11 ax0.set_title('many objects')
12 ax1.imshow(chull,plt.cm.gray)
13 ax1.set_title('convex_hull image')
14 plt.show()
看不懂也写不下去了...