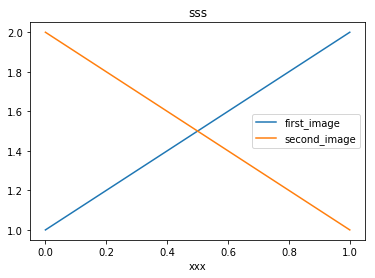
The exact pixel coordinates of title, labels, legends or ticks are important information for the training data of deep learning.
import numpy as np
import matplotlib.pyplot as plt

plt.plot([1,2],label="first_image")
plt.plot([2,1],label="second_image")
leg = plt.legend()

tit = plt.title("sss")
xla = plt.xlabel("xxx")

plt.gcf().canvas.draw()
ticks = [t for t in plt.gca().get_xticklabels()]

print(tit.get_text(),str(tit.get_window_extent()))    # return the context and pixel coordinates of 'tit'
print(np.array(tit.get_window_extent()))
print(xla.get_text(),str(xla.get_window_extent()))

for i, t in enumerate(ticks):
    print ("Label "+str(i)+", data: "+t.get_text()+str(t.get_window_extent()))

print ("Legend location: "+str(leg.get_window_extent()))
for i, l in enumerate(leg.texts):
    print ("Label "+str(i)+", data: "+l.get_text()+str(l.get_window_extent()))
    pass
#plt.savefig("test.png")
plt.show()
sss Bbox(x0=211.8375, y0=256.44, x1=230.9625, y1=269.44)
[[ 211.8375  256.44  ]
 [ 230.9625  269.44  ]]
xxx Bbox(x0=212.5875, y0=5.0, x1=230.2125, y1=15.0)
Label 0, data: Bbox(x0=69.21818181818182, y0=29.0, x1=69.21818181818182, y1=29.0)
Label 1, data: 0.0Bbox(x0=61.21818181818182, y0=19.0, x1=77.21818181818182, y1=29.0)
Label 2, data: 0.2Bbox(x0=122.0909090909091, y0=19.0, x1=138.0909090909091, y1=29.0)
Label 3, data: 0.4Bbox(x0=182.9636363636364, y0=19.0, x1=198.9636363636364, y1=29.0)
Label 4, data: 0.6Bbox(x0=243.83636363636367, y0=19.0, x1=259.83636363636367, y1=29.0)
Label 5, data: 0.8Bbox(x0=304.70909090909095, y0=19.0, x1=320.70909090909095, y1=29.0)
Label 6, data: 1.0Bbox(x0=365.5818181818182, y0=19.0, x1=381.5818181818182, y1=29.0)
Label 7, data: Bbox(x0=69.21818181818182, y0=29.0, x1=69.21818181818182, y1=29.0)
Legend location: Bbox(x0=276.05, y0=127.31375, x1=383.8, y1=162.12625)
Label 0, data: first_imageBbox(x0=308.05, y0=147.22, x1=363.925, y1=158.12625)
Label 1, data: second_imageBbox(x0=308.05, y0=131.31375, x1=379.8, y1=142.22)
reference:
1. https://matplotlib.org/api/text_api.html#matplotlib.text.Annotation.get_window_extent
2. https://matplotlib.org/api/transformations.html#matplotlib.transforms.Bbox