项目地址
https://www.kaggle.com/c/titanic
项目介绍:
除了乘客的编号以外,还包括下表中10个字段,构成了数据的所有特征
|
Variable |
Definition |
Key |
|
survival |
是否存活 |
0 = No, 1 = Yes |
|
pclass |
票的等级 |
1 = 1st, 2 = 2nd, 3 = 3rd |
|
sex |
性别 |
|
|
Age |
年龄 |
|
|
sibsp |
同乘配偶或兄弟姐妹 |
|
|
parch |
同乘孩子或父母 |
|
|
ticket |
票号 |
|
|
fare |
乘客票价 |
|
|
cabin |
客舱号码 |
|
|
embarked |
登船港口 |
C = Cherbourg, Q = Queenstown, S = Southampton |
一、导入数据
train_df = pd.read_csv("..	rain.csv")
test_df = pd.read_csv("..	est.csv")
查看数据整体缺失情况
结果如下:存在null值得字段有Age、Fare和Cabin,其中Cabin缺失最为严重,缺失率77.1%
train_df.info()
<class 'pandas.core.frame.DataFrame'>
RangeIndex: 891 entries, 0 to 890
Data columns (total 12 columns):
PassengerId    891 non-null int64
Survived       891 non-null int64
Pclass         891 non-null int64
Name           891 non-null object
Sex            891 non-null object
Age            714 non-null float64
SibSp          891 non-null int64
Parch          891 non-null int64
Ticket         891 non-null object
Fare           891 non-null float64
Cabin          204 non-null object
Embarked       889 non-null object
连续型变量分布情况
train_df.describe()
       PassengerId    Survived      Pclass         Age       SibSp
count   891.000000  891.000000  891.000000  714.000000  891.000000
mean    446.000000    0.383838    2.308642   29.699118    0.523008
std     257.353842    0.486592    0.836071   14.526497    1.102743
min       1.000000    0.000000    1.000000    0.420000    0.000000
25%     223.500000    0.000000    2.000000   20.125000    0.000000
50%     446.000000    0.000000    3.000000   28.000000    0.000000
75%     668.500000    1.000000    3.000000   38.000000    1.000000
max     891.000000    1.000000    3.000000   80.000000    8.000000
            Parch        Fare
count  891.000000  891.000000
mean     0.381594   32.204208
std      0.806057   49.693429
min      0.000000    0.000000
25%      0.000000    7.910400
50%      0.000000   14.454200
75%      0.000000   31.000000
max      6.000000  512.329200
离散变量情况( 包括客舱号码,登船港口,票的等级,性别)
train_df.describe(include=['O'])
                         Name   Sex  Ticket    Cabin Embarked
count                     891   891     891      204      889
unique                    891     2     681      147        3
top     Greenberg, Mr. Samuel  male  347082  B96 B98        S
freq                        1   577       7        4      644
- Total samples are 891 or 40% of the actual number of passengers on board the Titanic (2,224).
- Survived is a categorical feature with 0 or 1 values.
- Around 38% samples survived representative of the actual survival rate at 32%.
- Most passengers (> 75%) did not travel with parents or children.
- Nearly 30% of the passengers had siblings and/or spouse aboard.
- Fares varied significantly with few passengers (<1%) paying as high as $512.
- Few elderly passengers (<1%) within age range 65-80.
讨论特征增加和删除:
delete:用户id,用户名称可能需要删掉
create:Age range feature,fare range feature
discuss:年龄小的,性别为女的获救的几率应该比较大
train_df[['Pclass', 'Survived']].groupby(['Pclass'], as_index=False).mean().sort_values(by='Survived', ascending=False)
   Pclass  Survived
0       1  0.629630
1       2  0.472826
2       3  0.242363
train_df[['Sex', 'Survived']].groupby(['Sex'], as_index=False).mean().sort_values(by='Survived', ascending=False)
      Sex  Survived
0  female  0.742038
1    male  0.188908
二、可视化
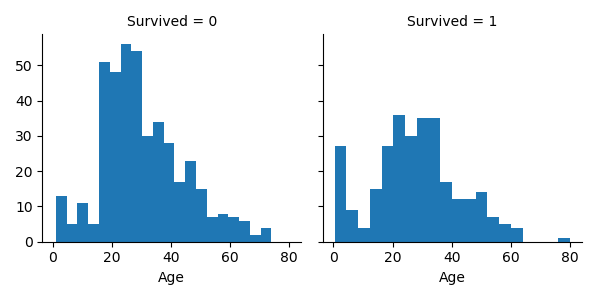
Survival by Age, Class and Gender
g = sns.FacetGrid(train_df, col='Survived')
g.map(plt.hist, 'Age', bins=20)
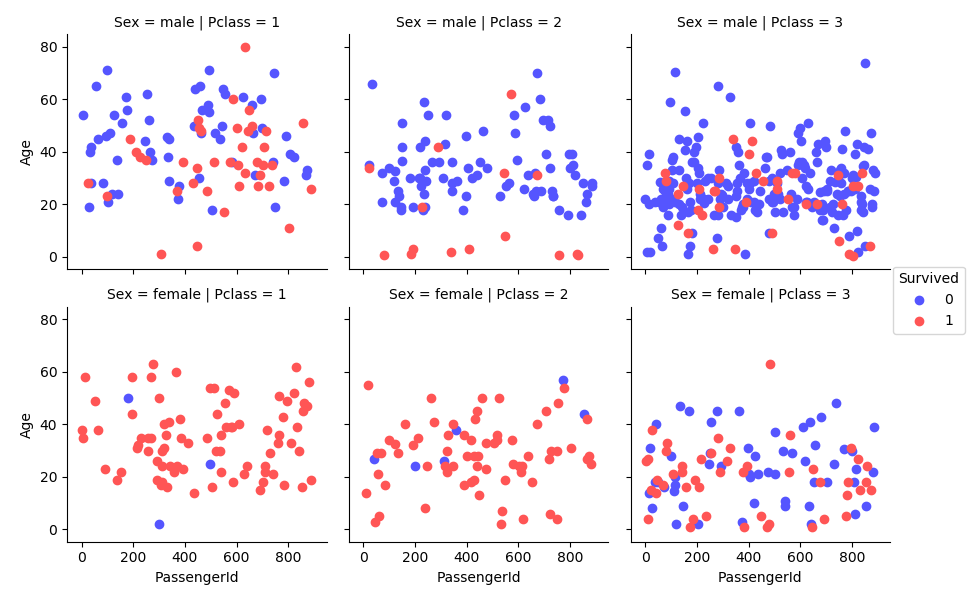
Survival by Age, Class and Gender
grid = sns.FacetGrid(train_df, col = "Pclass", row = "Sex", hue = "Survived", palette = 'seismic')
grid = grid.map(plt.scatter, "PassengerId", "Age")
grid.add_legend()

三、处理数据
3.1 去掉没得用的特征
删除数据中对预测没有实际效果的特征,提高模型速度,减少分析流程。
需要删除的特征有:客舱号码Cabin、票号Tickets
train_df = train_df.drop(['Ticket','Cabin'],axis=1)
test_df = test_df.drop(['Ticket','Cabin'],axis=1)
3.2 建立新的特征
对人名进行分析发现,带有master的一般都活下来了,于是对人名进行拆分,提取,和.之间的数据
combine = [train_df, test_df]
for dataset in combine:
    dataset['Title'] = dataset.Name.str.extract('([A-Za-z]+).',expand=False)