zoukankan      html  css  js  c++  java
  • google原版:Debugging WebAssembly with modern tools

    开启drawf这种调试文件后,可以调试。
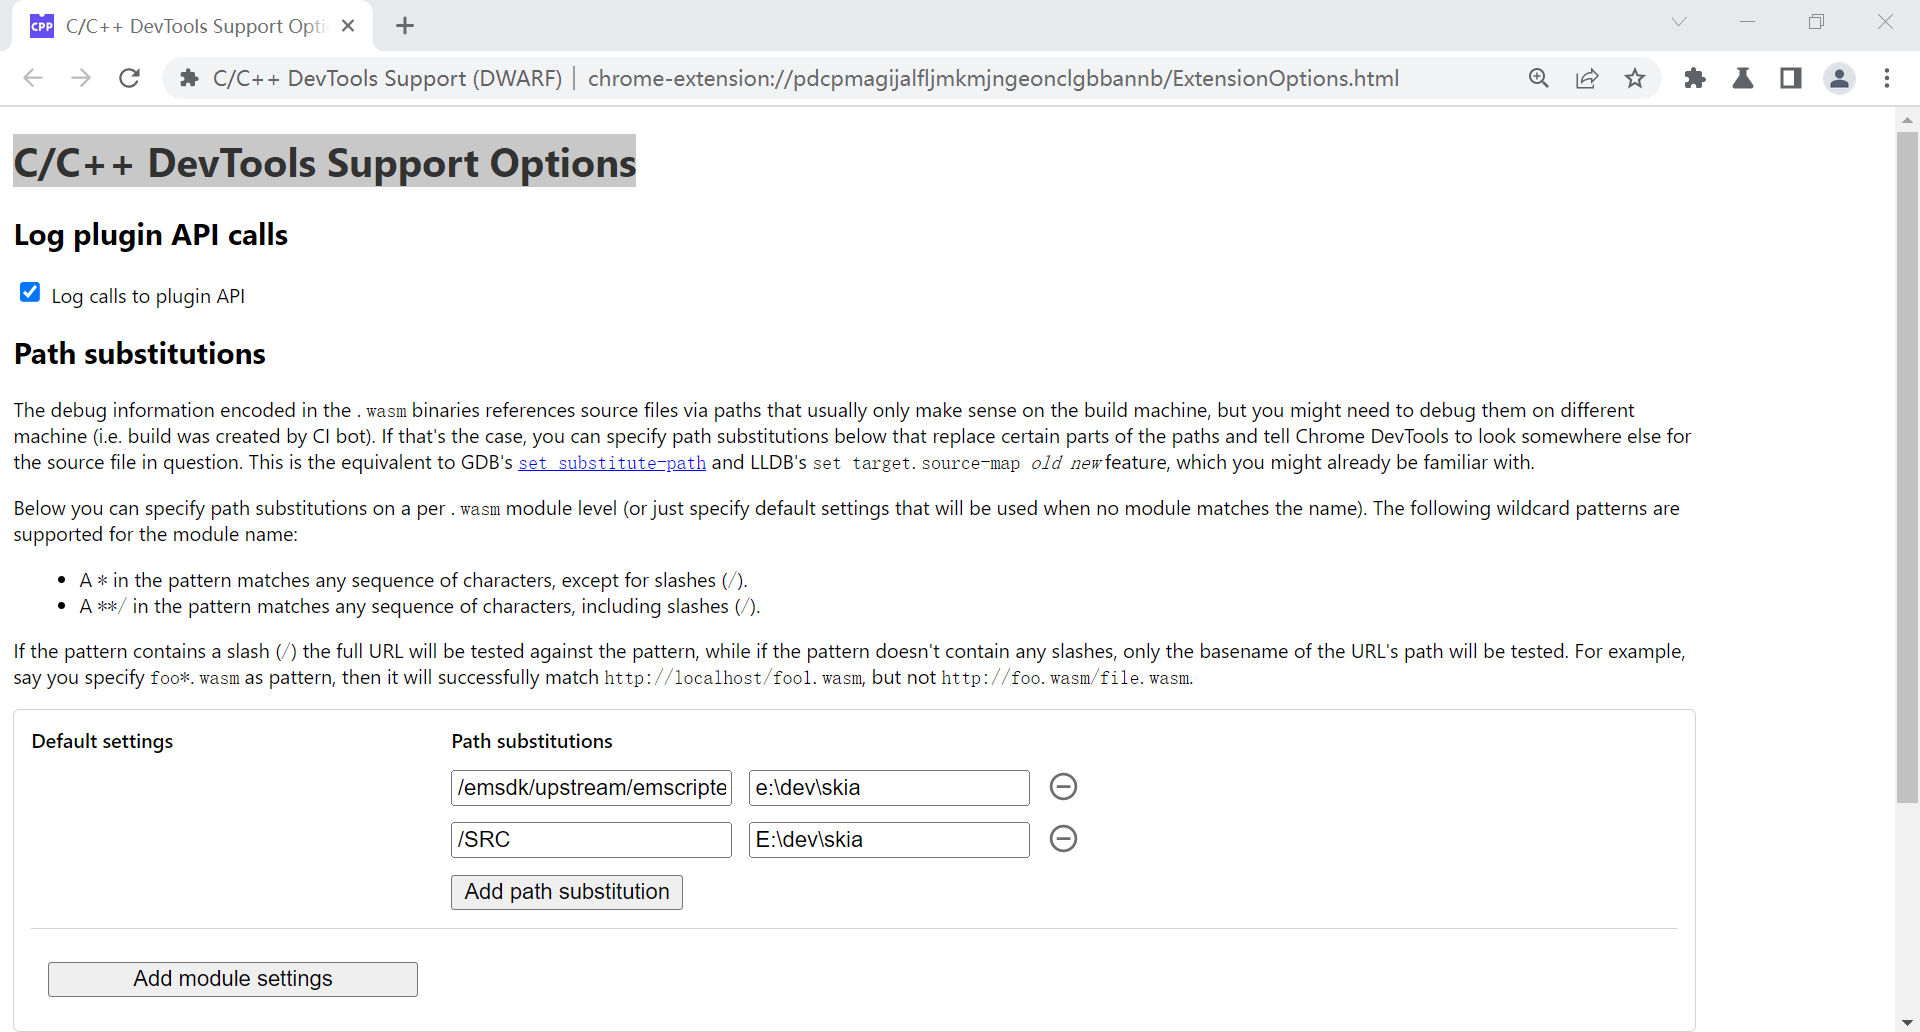
    在docker中运行,或者远程机器运行时,源码不在本地。需要利用源码路径重映射。将wasm里面显示的file://路径,重新指定成本地复制的源码路径:
    在扩展c++ devtools 的选项中设置路径映射:


    Debugging WebAssembly with modern tools

    Published on Thursday, December 10, 2020

    Table of contents

    Interested in helping improve DevTools? Sign up to participate in Google User Research here.

    #The road so far

    A year ago, Chrome announced initial support for native WebAssembly debugging in Chrome DevTools.

    We demonstrated basic stepping support and talked about opportunities usage of DWARF information instead of source maps opens for us in the future:

    • Resolving variable names
    • Pretty-printing types
    • Evaluating expressions in source languages
    • …and much more!

    Today, we're excited to showcase the promised features come into life and the progress Emscripten and Chrome DevTools teams have made over this year, in particular, for C and C++ apps.

    Before we start, please keep in mind that this is still a beta version of the new experience, you need to use the latest version of all tools at your own risk, and if you run into any issues, please report them to https://bugs.chromium.org/p/chromium/issues/entry?template=DevTools+issue.

    Let's start with the same simple C example as the last time:

    #include <stdlib.h>

    void assert_less(int x, int y) {
    if (x >= y) {
    abort();
    }
    }

    int main() {
    assert_less(10, 20);
    assert_less(30, 20);
    }

    To compile it, we use latest Emscripten and pass a -g flag, just like in the original post, to include debug information:

    emcc -g temp.c -o temp.html
    

    Now we can serve the generated page from a localhost HTTP server (for example, with serve), and open it in the latest Chrome Canary.

    This time we'll also need a helper extension that integrates with Chrome DevTools and helps it make sense of all the debugging information encoded in the WebAssembly file. Please install it by going to this link: goo.gle/wasm-debugging-extension

    You'll also want to enable WebAssembly debugging in the DevTools Experiments. Open Chrome DevTools, click the gear () icon in the top right corner of DevTools pane, go to the Experiments panel and tick WebAssembly Debugging: Enable DWARF support.
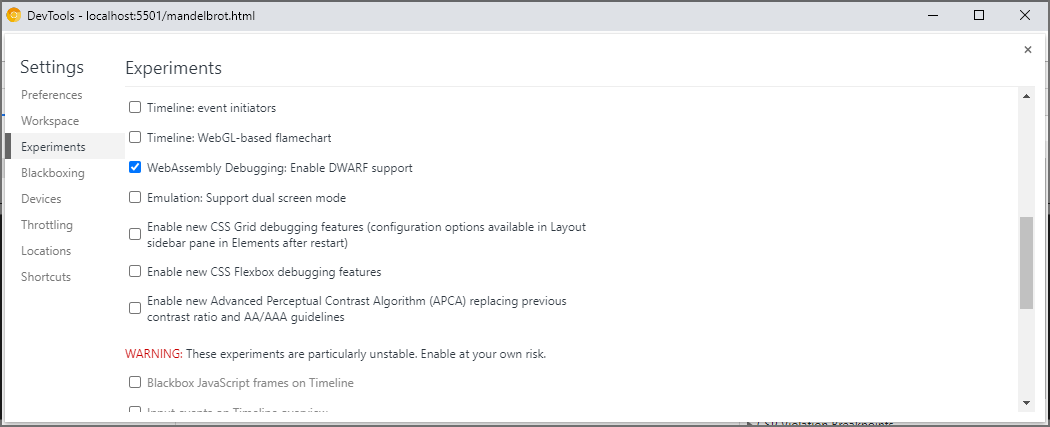
    Experiments pane of the DevTools settings

    When you close the Settings, DevTools will suggest to reload itself to apply settings, so let's do just that. That's it for the one-off setup.

    Now we can go back to the Sources panel, enable Pause on exceptions (⏸ icon), then check Pause on caught exceptions and reload the page. You should see the DevTools paused on an exception:
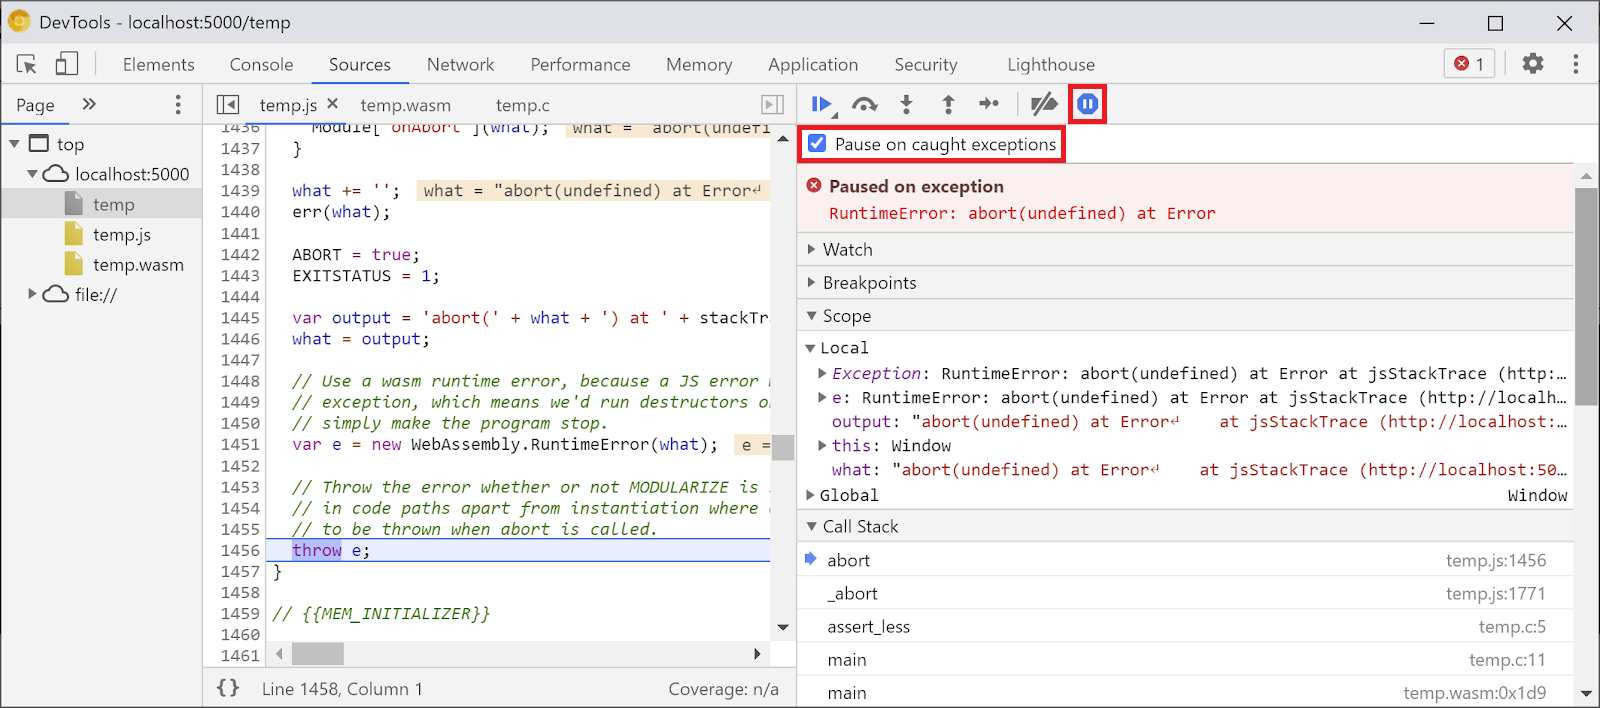
    Screenshot of the Sources panel showing how to enable 'Pause on caugh exceptions'

    By default, it stops on an Emscripten-generated glue code, but on the right you can see a Call Stack view representing the stacktrace of the error, and can navigate to the original C line that invoked abort:
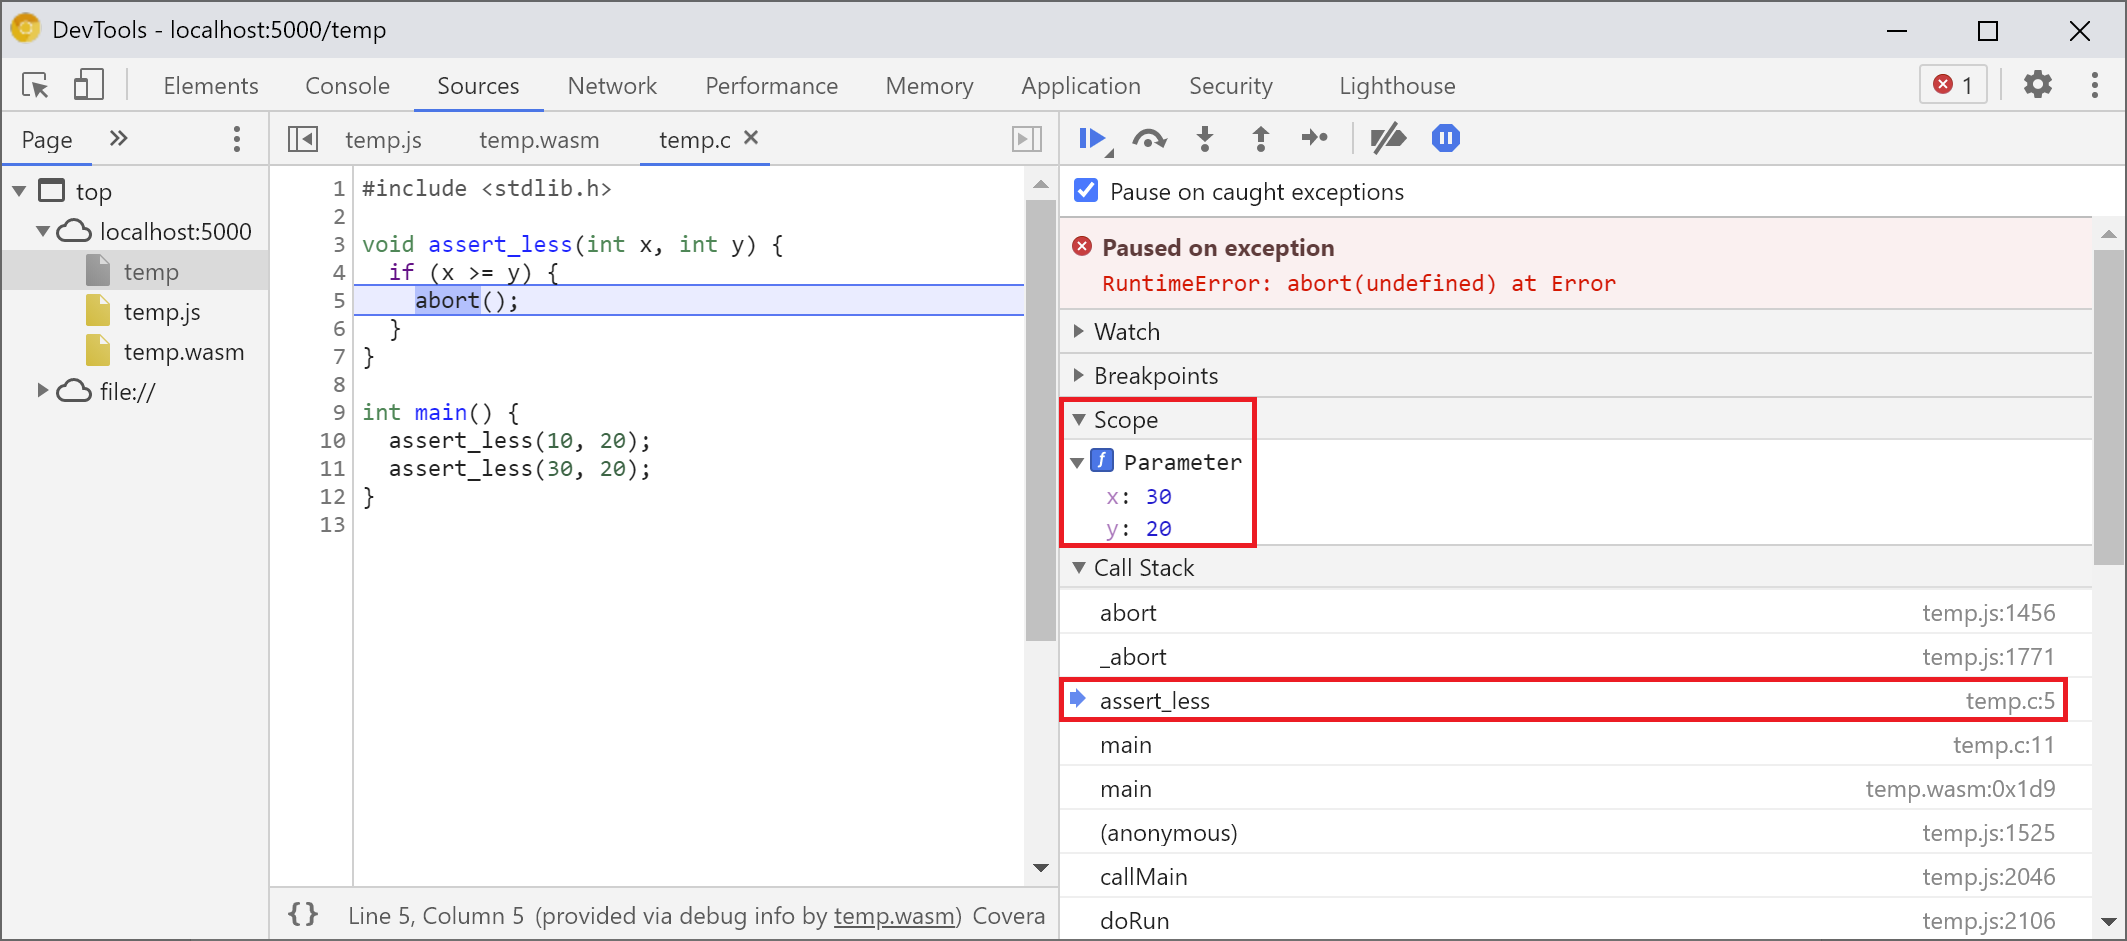
    DevTools paused in the `assert_less` function and showing values of `x` and `y` in the Scope view

    Now, if you look in the Scope view, you can see the original names and values of variables in the C/C++ code, and no longer have to figure out what mangled names like $localN mean and how they relate to the source code you've written.

    This applies not only to primitive values like integers, but to compound types like structures, classes, arrays, etc., too!

    #Rich type support

    Let's take a look at a more complicated example to show those. This time, we'll draw a Mandelbrot fractal with the following C++ code:

    #include <SDL2/SDL.h>
    #include <complex>

    int main() {
    // Init SDL.
    int width = 600, height = 600;
    SDL_Init(SDL_INIT_VIDEO);
    SDL_Window* window;
    SDL_Renderer* renderer;
    SDL_CreateWindowAndRenderer(width, height, SDL_WINDOW_OPENGL, &window,
    &renderer);

    // Generate a palette with random colors.
    enum { MAX_ITER_COUNT = 256 };
    SDL_Color palette[MAX_ITER_COUNT];
    srand(time(0));
    for (int i = 0; i < MAX_ITER_COUNT; ++i) {
    palette[i] = {
    .r = (uint8_t)rand(),
    .g = (uint8_t)rand(),
    .b = (uint8_t)rand(),
    .a = 255,
    };
    }

    // Calculate and draw the Mandelbrot set.
    std::complex<double> center(0.5, 0.5);
    double scale = 4.0;
    for (int y = 0; y < height; y++) {
    for (int x = 0; x < width; x++) {
    std::complex<double> point((double)x / width, (double)y / height);
    std::complex<double> c = (point - center) * scale;
    std::complex<double> z(0, 0);
    int i = 0;
    for (; i < MAX_ITER_COUNT - 1; i++) {
    z = z * z + c;
    if (abs(z) > 2.0)
    break;
    }
    SDL_Color color = palette[i];
    SDL_SetRenderDrawColor(renderer, color.r, color.g, color.b, color.a);
    SDL_RenderDrawPoint(renderer, x, y);
    }
    }

    // Render everything we've drawn to the canvas.
    SDL_RenderPresent(renderer);

    // SDL_Quit();
    }

    You can see that this application is still fairly small-it's a single file containing 50 lines of code-but this time I'm also using some external APIs, like SDL library for graphics as well as complex numbers from the C++ standard library.

    I'm going to compile it with the same -g flag as above to include debug information, and also I'll ask Emscripten to provide the SDL2 library and allow arbitrarily-sized memory:

    emcc -g mandelbrot.cc -o mandelbrot.html \
         -s USE_SDL=2 \
         -s ALLOW_MEMORY_GROWTH=1
    

    When I visit the generated page in the browser, I can see the beautiful fractal shape with some random colors:

    Demo page

    When I open DevTools, once again, I can see the original C++ file. This time, however, we don't have an error in the code (whew!), so let's set some breakpoint at the beginning of our code instead.

    When we reload the page again, the debugger will pause right inside our C++ source:

    DevTools paused on the `SDL_Init` call

    We can already see all our variables on the right, but only width and height are initialized at the moment, so there isn't much to inspect.

    Let's set another breakpoint inside our main Mandelbrot loop, and resume execution to skip a bit forward.

    DevTools paused inside the nested loops

    At this point our palette has been filled with some random colors, and we can expand both the array itself, as well as the individual SDL_Color structures and inspect their components to verify that everything looks good (for example, that "alpha" channel is always set to full opacity). Similarly, we can expand and check the real and imaginary parts of the complex number stored in the center variable.

    If you want to access a deeply nested property that is otherwise hard to navigate to via the Scope view, you can use the Console evaluation, too! However, note that more complex C++ expressions are not yet supported.

    Console panel showing the result of `palette[10].r`

    Let's resume execution a few times and we can see how the inner x is changing as well-either by looking in the Scope view again, adding the variable name to the watch list, evaluating it in the console, or by hovering over the variable in the source code:

    Tooltip over the variable `x` in the source showing its value `3`

    From here, we can step-in or step-over C++ statements, and observe how other variables are changing too:

    Tooltips and Scope view showing values of `color`, `point` and other variables

    Okay, so this all works great when a debug information is available, but what if we want to debug a code that wasn't built with the debugging options?

    #Raw WebAssembly debugging

    For example, we asked Emscripten to provide a prebuilt SDL library for us, instead of compiling it ourselves from the source, so-at least currently-there's no way for the debugger to find associated sources. Let's step-in again to get into the SDL_RenderDrawColor:

    DevTools showing disassembly view of `mandelbrot.wasm`

    We're back to the raw WebAssembly debugging experience.

    Now, it looks a bit scary and isn't something most Web developers will ever need to deal with, but occasionally you might want to debug a library built without debug information-whether because it's a 3rd-party library you have no control over, or because you're running into one of those bugs that occurs only on production.

    To aid in those cases, we've made some improvements to the basic debugging experience, too.

    First of all, if you used raw WebAssembly debugging before, you might notice that the entire disassembly is now shown in a single file-no more guessing which function a Sources entry wasm-53834e3e/ wasm-53834e3e-7 possibly corresponds to.

    #New name generation scheme

    We improved names in the disassembly view, too. Previously you'd see just numeric indices, or, in case of functions, no name at all.

    Now we're generating names similarly to other disassembly tools, by using hints from the WebAssembly name section, import/export paths and, finally, if everything else fails, generating them based on the type and the index of the item like $func123. You can see how, in the screenshot above, this already helps to get slightly more readable stacktraces and disassembly.

    When there is no type information available, it might be hard to inspect any values besides the primitives-for example, pointers will show up as regular integers, with no way of knowing what's stored behind them in memory.

    #Memory inspection

    Previously, you could only expand the WebAssembly memory object, represented by env.memory in the Scope view-to look up individual bytes. This worked in some trivial scenarios, but wasn't particularly convenient to expand and didn't allow to reinterpret data in formats other than byte values. We've added a new feature to help with this, too: a linear memory inspector.

    If you right-click on the env.memory, you should now see a new option called Inspect memory:

    Context menu on the `env.memory` in the Scope pane showing an 'Inspect Memory' item

    Once clicked, it will bring up a Memory Inspector, in which you can inspect the WebAssembly memory in hexadecimal and ASCII views, navigate to specific addresses, as well as interpret the data in different formats:

    Memory Inspector pane in DevTools showing a hex and ASCII views of the memory

    #Advanced scenarios and caveats

    #Profiling WebAssembly code

    When you open DevTools, WebAssembly code gets "tiered down" to an unoptimized version to enable debugging. This version is a lot slower, which means that you can't rely on console.timeperformance.now and other methods of measuring speed of your code while DevTools are open, as the numbers you get won't represent the real-world performance at all.

    Instead, you should use the DevTools Performance panel which will run the code at the full speed and provide you with a detailed breakdown of the time spent in different functions:

    Profiling panel showing various Wasm functions

    Alternatively, you can run your application with DevTools closed, and open them once finished to inspect the Console.

    We'll be improving profiling scenarios in the future, but for now it's a caveat to be aware of. If you want to learn more about WebAssembly tiering scenarios, check out our docs on WebAssembly compilation pipeline.

    #Building and debugging on different machines (including Docker / host)

    When building in a Docker, virtual machine, or on a remote build server, you will likely run into situations where the paths to the source files used during the build don't match the paths on your own filesystem where the Chrome DevTools are running. In this case, files will show up in the Sources panel but fail to load.

    To fix this issue, we have implemented a path mapping functionality in the C/C++ extension options. You can use it to remap arbitrary paths and help the DevTools locate sources.

    For example, if the project on your host machine is under a path C:\src\my_project, but was built inside a Docker container where that path was represented as /mnt/c/src/my_project, you can remap it back during debugging by specifying those paths as prefixes:

    Options page of the C/C++ debugging extension

    The first matched prefix "wins". If you're familiar with other C++ debuggers, this option is similar to the set substitute-path command in GDB or a target.source-map setting in LLDB.

    #Debugging optimized builds

    Like with any other languages, debugging works best if optimizations are disabled. Optimizations might inline functions one into another, reorder code, or remove parts of the code altogether-and all of this has a chance to confuse the debugger and, consequently, you as the user.

    If you don't mind a more limited debugging experience and still want to debug an optimized build, then most of the optimizations will work as expected, except for function inlining. We plan to address the remaining issues in the future, but, for now, please use -fno-inline to disable it when compiling with any -O level optimizations, e.g.:

    emcc -g temp.c -o temp.html \
         -O3 -fno-inline
    

    #Separating the debug information

    Debug information preserves lots of details about your code, defined types, variables, functions, scopes, and locations-anything that might be useful to the debugger. As a result, it often can be larger than the code itself.

    To speed up loading and compilation of the WebAssembly module, you might want to split out this debug information into a separate WebAssembly file. To do that in Emscripten, pass a -gseparate-dwarf=… flag with a desired filename:

    emcc -g temp.c -o temp.html \
         -gseparate-dwarf=temp.debug.wasm
    

    In this case, the main application will only store a filename temp.debug.wasm, and the helper extension will be able to locate and load it when you open DevTools.

    When combined with optimizations like described above, this feature can be even used to ship almost-optimized production builds of your application, and later debug them with a local side file. In this case, we'll additionally need to override the stored URL to help the extension find the side file, for example:

    emcc -g temp.c -o temp.html \
         -O3 -fno-inline \
         -gseparate-dwarf=temp.debug.wasm \
         -s SEPARATE_DWARF_URL=file://[local path to temp.debug.wasm]
    

    #To be continued…

    Whew, that was a lot of new features!

    With all those new integrations, Chrome DevTools becomes a viable, powerful, debugger not only for JavaScript, but also for C and C++ apps, making it easier than ever to take apps, built in a variety of technologies and bring them to a shared, cross-platform Web.

    However, our journey is not over yet. Some of the things we'll be working on from here on:

    • Cleaning up the rough edges in the debugging experience.
    • Adding support for custom type formatters.
    • Working on improvements to the profiling for WebAssembly apps.
    • Adding support for code coverage to make it easier to find unused code.
    • Improving support for expressions in console evaluation.
    • Adding support for more languages.
    • …and more!

    Meanwhile, please help us out by trying the current beta on your own code and reporting any found issues to https://bugs.chromium.org/p/chromium/issues/entry?template=DevTools+issue.

    #Download the preview channels

    Consider using the Chrome CanaryDev or Beta as your default development browser. These preview channels give you access to the latest DevTools features, test cutting-edge web platform APIs, and find issues on your site before your users do!

    #Getting in touch with the Chrome DevTools team

    Use the following options to discuss the new features and changes in the post, or anything else related to DevTools.

    • Submit a suggestion or feedback to us via crbug.com.
    • Report a DevTools issue using the More options   More   > Help > Report a DevTools issues in DevTools.
    • Tweet at @ChromeDevTools.
    • Leave comments on our What's new in DevTools YouTube videos.

    #More from the Chrome DevTools team

    Subscribe to Chrome DevTools blog to stay up to date with the DevTools news.

    Last updated: Thursday, December 10, 2020 • Improve article

     
  • 相关阅读:
    BestCoder Round #32
    USACO Runaround Numbers
    USACO Subset Sums
    USACO Sorting a Three-Valued Sequence
    USACO Ordered Fractions
    USACO 2.1 The Castle
    Codeforces Round #252 (Div. 2)
    Codeforces Round #292 (Div. 2)
    BZOJ 1604: [Usaco2008 Open]Cow Neighborhoods 奶牛的邻居
    BZOJ 1603: [Usaco2008 Oct]打谷机
  • 原文地址:https://www.cnblogs.com/bigben0123/p/15753336.html
Copyright © 2011-2022 走看看