一、环境准备
-
Kubernetes:1.19.2
-
Elasticsearch:外部Elasticsearch,版本7.8
-
Kibana:外部Kibana,版本7.8
-
filebeat: elastic/filebeat:7.8.0
-
logstash: elastic/logstash:7.8.0
-
redis: redis:5.0.10-alpine
二、日志目录
K8S中的日志目录有3种:
- /var/lib/docker/containers
- /var/log/containers
- /var/log/pods
它们之间的联系
- 当Docker 作为 k8s 容器运行时,容器日志的落盘将由 docker 来完成,保存在/var/lib/docker/containers/$CONTAINERID 目录下
- Kubelet 会在 /var/log/pods 和 /var/log/containers 下建立软链接,指向 /var/lib/docker/containers/CONTAINERID 该目录下的容器日志文件
- 当Containerd 作为 k8s 容器运行时, 容器日志的落盘由 Kubelet 来完成,保存至 /var/log/pods/$CONTAINER_NAME 目录下,同时在 /var/log/containers 目录下创建软链接,指向日志文件
/var/log/containers目录中日志名称:podName_NameSpace_ContainerName_ContainerID
三、创建External service
用于连接K8s外部的elasticsearch
先创建一个public-serivce的namespace
kubectl create ns public-service
es-svc-external.yaml
apiVersion: v1
kind: Service
metadata:
  name: elaticsearch-svc-external
  namespace: public-service
  labels:
    app: elaticsearch-svc-external
spec:
  ports:
  - port: 9200
    name: elaticsearch-svc-external
    protocol: TCP
  type: ClusterIP
创建elasticsearch的endpoint
es-ep.yaml
apiVersion: v1
kind: Endpoints
metadata:
  labels:
    app: elaticsearch-svc-external
  name: elaticsearch-svc-external
  namespace: public-service
subsets:
- addresses:
  - ip: 192.168.100.144
  ports:
  - name: elaticsearch-svc-external
    port: 9200
    protocol: TCP
查看
kubectl get svc -n public-service
NAME                        TYPE        CLUSTER-IP       EXTERNAL-IP   PORT(S)    AGE
elaticsearch-svc-external   ClusterIP   10.109.66.130    <none>        9200/TCP   43h

kubectl get ep -n public-service
NAME                        ENDPOINTS              AGE
elaticsearch-svc-external   192.168.100.144:9200   43h
测试,启动一个带curl的pod测试能否获取elasticsearch的信息
这个elasticsearch有安全认证
curl -XGET --user elastic:elastic http://elaticsearch-svc-external.public-service:9200/_cluster/health?pretty=true
{
  "cluster_name" : "es-cluster",
  "status" : "yellow",
  "timed_out" : false,
  "number_of_nodes" : 1,
  "number_of_data_nodes" : 1,
  "active_primary_shards" : 11,
  "active_shards" : 11,
  "relocating_shards" : 0,
  "initializing_shards" : 0,
  "unassigned_shards" : 3,
  "delayed_unassigned_shards" : 0,
  "number_of_pending_tasks" : 0,
  "number_of_in_flight_fetch" : 0,
  "task_max_waiting_in_queue_millis" : 0,
  "active_shards_percent_as_number" : 78.57142857142857
}
redis.yaml
apiVersion: v1
kind: Service
metadata:
  name: redis-svc
  namespace: public-service
  labels:
    app:  redis
spec:
  selector:
    app: redis-single
  ports:
    - protocol: TCP
      port: 6379
      targetPort: 6379

---
apiVersion: apps/v1
kind: Deployment
metadata:
  annotations:
    deployment.kubernetes.io/revision: "18"
  labels:
    app: redis
  name: redis
  namespace: public-service
spec:
  replicas: 1
  revisionHistoryLimit: 10
  selector:
    matchLabels:
      app: redis-single
  strategy:
    rollingUpdate:
      maxSurge: 1
      maxUnavailable: 0
    type: RollingUpdate
  template:
    metadata:
      labels:
        app: redis-single
    spec:
      nodeSelector:
        logging: "true"
      affinity:
        podAntiAffinity:
          preferredDuringSchedulingIgnoredDuringExecution:
          - podAffinityTerm:
              labelSelector:
                matchExpressions:
                - key: app
                  operator: In
                  values:
                  - redis-single
              topologyKey: kubernetes.io/hostname
            weight: 100
      containers:
      - command:
        - redis-server
        - /usr/local/etc/redis.conf
        env:
        - name: TZ
          value: Asia/Shanghai
        - name: LANG
          value: C.UTF-8
        image: redis:5.0.10-alpine
        imagePullPolicy: IfNotPresent
        lifecycle: {}
        livenessProbe:
          failureThreshold: 2
          initialDelaySeconds: 10
          periodSeconds: 10
          successThreshold: 1
          tcpSocket:
            port: 6379
          timeoutSeconds: 2
        name: redis
        ports:
        - containerPort: 6379
          name: redis-port
          protocol: TCP
        readinessProbe:
          failureThreshold: 2
          initialDelaySeconds: 10
          periodSeconds: 10
          successThreshold: 1
          tcpSocket:
            port: 6379
          timeoutSeconds: 2
        resources:
          limits:
            cpu: 100m
            memory: 100Mi
          requests:
            cpu: 10m
            memory: 10Mi
        volumeMounts:
        - mountPath: /usr/share/zoneinfo/Asia/Shanghai
          name: tz-config
        - mountPath: /etc/localtime
          name: tz-config
        - mountPath: /usr/local/etc/
          name: redis-conf
      dnsPolicy: ClusterFirst
      restartPolicy: Always
      schedulerName: default-scheduler
      securityContext: {}
      terminationGracePeriodSeconds: 30
      tolerations:
      - effect: NoExecute
        key: node.kubernetes.io/unreachable
        operator: Exists
        tolerationSeconds: 30
      - effect: NoExecute
        key: node.kubernetes.io/not-ready
        operator: Exists
        tolerationSeconds: 30
      volumes:
      - hostPath:
          path: /usr/share/zoneinfo/Asia/Shanghai
          type: ""
        name: tz-config
      - configMap:
          name: redis-conf
        name: redis-conf
- nodeSelector 选择一个节点部署
redis.conf
protected-mode no
port 6379
tcp-backlog 511
timeout 0
tcp-keepalive 300
#daemonize yes
supervised no
loglevel notice
logfile "/data/redis.log"
databases 16
always-show-logo yes
save 900 1
save 300 10
save 60 10000
stop-writes-on-bgsave-error yes
rdbcompression yes
rdbchecksum yes
dir "/data"
slave-serve-stale-data yes
slave-read-only yes
repl-diskless-sync no
repl-diskless-sync-delay 5
repl-disable-tcp-nodelay no
slave-priority 100
lazyfree-lazy-eviction no
lazyfree-lazy-expire no
lazyfree-lazy-server-del no
slave-lazy-flush no
appendonly yes
appendfilename "appendonly.aof"
appendfsync everysec
no-appendfsync-on-rewrite no
auto-aof-rewrite-percentage 100
auto-aof-rewrite-min-size 1gb
aof-load-truncated yes
aof-use-rdb-preamble no
lua-time-limit 5000
slowlog-log-slower-than 10000
slowlog-max-len 128
latency-monitor-threshold 0
notify-keyspace-events "xE"
hash-max-ziplist-entries 512
hash-max-ziplist-value 64
list-max-ziplist-size -2
list-compress-depth 0
set-max-intset-entries 512
zset-max-ziplist-entries 128
zset-max-ziplist-value 64
hll-sparse-max-bytes 3000
activerehashing yes
client-output-buffer-limit normal 0 0 0
client-output-buffer-limit slave 256mb 64mb 60
client-output-buffer-limit pubsub 32mb 8mb 60
hz 10
aof-rewrite-incremental-fsync yes
创建
# kubectl create configmap redis-conf --from-file=redis.conf -n public-service

# kubectl create -f redis.yaml

# kubectl get pods  -n public-service
NAME                     READY   STATUS    RESTARTS   AGE
redis-6f45c688f9-j6jsn   1/1     Running   0          130m

# kubectl get svc -n public-service | grep redis
redis-svc                   ClusterIP   10.107.68.121    <none>        6379/TCP   137m
filebeat-configmap.yaml
apiVersion: v1
kind: ConfigMap
metadata:
  name: filebeat-config
  namespace: logging
  labels:
    k8s-app: filebeat
data:
  filebeat.yml: |-
    filebeat.inputs:
    - type: container
      paths:
        # 项目以pb开头
        - /var/log/containers/pb-*.log

      #多行合并
      multiline.pattern: '^[0-9]{4}-[0-9]{2}-[0-9]{2}'
      multiline.negate: true
      multiline.match: after
      multiline.timeout: 30
      fields:
        #自定义字段用于logstash识别k8s输入的日志
        service: java-log

      processors:
        - add_kubernetes_metadata:
            #添加k8s描述字段
            default_indexers.enabled: true
            default_matchers.enabled: true
            host: ${NODE_NAME}
            matchers:
            - logs_path:
                logs_path: "/var/log/containers/"
        - drop_fields:
            #删除的多余字段
            fields: ["host", "tags", "ecs", "log", "prospector", "agent", "input", "beat", "offset"]
            ignore_missing: true
    output.redis:
      # 不同namespace下的service联通需要添加其所在的namespace名称
      hosts: ["redis-svc.public-service"]
      key: "filebeat"
      db: 1
      timeout: 5
filebeat-rbac.yaml
apiVersion: rbac.authorization.k8s.io/v1
kind: ClusterRoleBinding
metadata:
  name: filebeat
subjects:
- kind: ServiceAccount
  name: filebeat
  namespace: logging
roleRef:
  kind: ClusterRole
  name: filebeat
  apiGroup: rbac.authorization.k8s.io
---
apiVersion: rbac.authorization.k8s.io/v1
kind: ClusterRole
metadata:
  name: filebeat
  labels:
    k8s-app: filebeat
rules:
- apiGroups: [""] # "" indicates the core API group
  resources:
  - namespaces
  - pods
  verbs:
  - get
  - watch
  - list
---
apiVersion: v1
kind: ServiceAccount
metadata:
  name: filebeat
  namespace: logging
  labels:
    k8s-app: filebeat
filebeat-daemonset.yaml
apiVersion: apps/v1
kind: DaemonSet
metadata:
  name: filebeat
  namespace: logging
  labels:
    k8s-app: filebeat
spec:
  selector:
    matchLabels:
      k8s-app: filebeat
  template:
    metadata:
      labels:
        k8s-app: filebeat
    spec:
      serviceAccountName: filebeat
      terminationGracePeriodSeconds: 30
      nodeSelector:
        logging: "true"
      containers:
      - name: filebeat
        image: docker.io/elastic/filebeat:7.8.0
        imagePullPolicy: IfNotPresent
        # args: [
        #   "-c", "/etc/filebeat.yml",
        #   "-e",
        # ]
        env:
        - name: NODE_NAME
          valueFrom:
            fieldRef:
              fieldPath: spec.nodeName
        securityContext:
          runAsUser: 0
          # If using Red Hat OpenShift uncomment this:
          #privileged: true
        resources:
          limits:
            memory: 200Mi
          requests:
            cpu: 100m
            memory: 100Mi
        volumeMounts:
        - name: config
          mountPath: /usr/share/filebeat/filebeat.yml
          readOnly: true
          subPath: filebeat.yml
        - name: varlibdockercontainers
          mountPath: /var/lib/docker/containers
        - name: varlog
          mountPath: /var/log
      volumes:
      - name: config
        configMap:
          defaultMode: 0640
          name: filebeat-config
      - name: varlibdockercontainers
        hostPath:
          path: /var/lib/docker/containers
      - name: varlog
        hostPath:
          path: /var/log
给选择的节点打标签,nodeSelector选择了需要采集日志的节点
# kubectl label node node01 logging=true
创建
# kubectl create ns  logging
# kubectl create -f .
查看
# kubectl get pod -n logging | grep filebeat
filebeat-z5276                        1/1     Running   0          132m

# kubectl get cm -n logging | grep filebeat
filebeat-config      1      8h
logstash-configmap.yaml
apiVersion: v1
kind: ConfigMap
metadata:
  name: logstash-configmap
  namespace: logging
data:
  logstash.yml: |
    http.host: "0.0.0.0"
    path.config: /usr/share/logstash/pipeline
  logstash.conf: |
    # all input will come from filebeat, no local logs
    input {
        beats {
          port => 5044
        }
        redis {
           host => "redis-svc.public-service"
           port => "6379"
           db => 1
           data_type => "list"
           key => "filebeat"
           type => "k8s-log"
          }
    }

    filter {
      if [fields][service] == "java-log" {
        grok {
                match => { "message" => "%{TIMESTAMP_ISO8601:logdatetime}s(?:[]|[%{UUID:trace_id}])s(?:%{SYSLOG5424SD:thread}|%{SYSLOG5424SD})s*%{LOGLEVEL:level}s*%{JAVACLASS:class}s-s%{GREEDYDATA:logmessage}"}
          remove_field => [ "message" ]
          remove_field => [ "agent" ]
          remove_field => [ "ecs" ]
          remove_field => [ "tags" ]
        }
      }
    }


    output {
      if [fields][service] == "java-log" {
        elasticsearch {
          hosts => ["elaticsearch-svc-external.public-service.svc.cluster.local:9200"]
          user => elastic
          password => elastic
          index => "k8s-%{[kubernetes][namespace]}-%{[kubernetes][labels][app]}-%{+YYYY.MM.dd}"
           }
    #stdout { codec => rubydebug { metadata => true}}
         }
      }
语法:https://github.com/logstash-plugins/logstash-patterns-core/blob/master/patterns/grok-patterns
测试:http://grokdebug.herokuapp.com/
-
index:自动创建索引,名称为(k8s-namespace-appname)需要在spec.template.namespace / spec.template.labels.app中写明需要的参数
logstash-deployment.yaml
apiVersion: apps/v1
kind: Deployment
metadata:
  name: logstash-deployment
  namespace: logging
spec:
  selector:
    matchLabels:
      app: logstash
  replicas: 1
  template:
    metadata:
      labels:
        app: logstash
    spec:
      nodeSelector:
        logging: "true"
      containers:
      - name: logstash
        image: elastic/logstash:7.8.0
        imagePullPolicy: IfNotPresent
        ports:
        - containerPort: 5044
        volumeMounts:
          - name: config-volume
            mountPath: /usr/share/logstash/config
          - name: logstash-pipeline-volume
            mountPath: /usr/share/logstash/pipeline
      volumes:
      - name: config-volume
        configMap:
          name: logstash-configmap
          items:
            - key: logstash.yml
              path: logstash.yml
      - name: logstash-pipeline-volume
        configMap:
          name: logstash-configmap
          items:
            - key: logstash.conf
              path: logstash.conf
创建
# kubectl create -f .
查看
# kubectl get pods -n logging | grep logstash
logstash-deployment-bc4d6c6dc-zsmrw   1/1     Running   0          135m
新建一个日志输出pod
counter-deploy.yaml
apiVersion: apps/v1
kind: Deployment
metadata:
  name: pb-counter
  namespace: logging
  labels:
    app: pb-counter
    logging: "true"
spec:
  replicas: 1
  selector:
    matchLabels:
      app: pb-counter
      logging: "true"
  template:
    metadata:
      name: pb-counter
      namespace: logging
      labels:
        app: pb-counter
        logging: "true"
    spec:
      nodeSelector:
        logging: "true"
      containers:
      - name: my-counter-test
        image: busybox
        imagePullPolicy: IfNotPresent
        args: [/bin/sh, -c, 'tail -n+1 -f /opt/msg/message.txt']
        volumeMounts:
        - name: msg
          mountPath: /opt/msg
      volumes:
      - name: msg
        configMap:
          name: msg
- msg:一段java日志,以configmap的形式挂载到pb-counter中
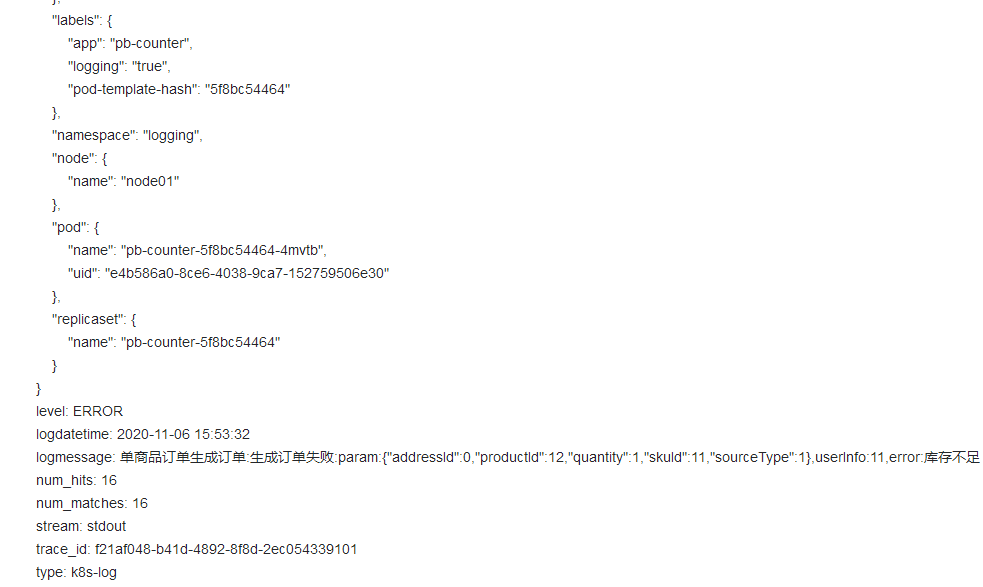
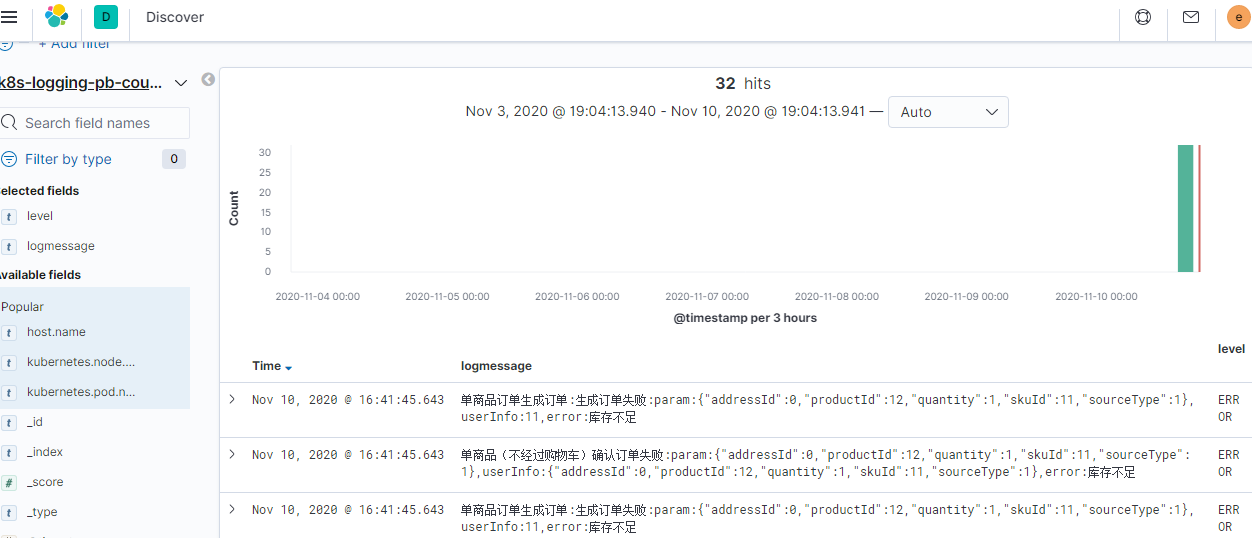
查看kibana

详细日志
apiVersion: v1
kind: ConfigMap
metadata:
  name: elastalert-config
  namespace: logging
  labels:
    app: elastalert
data:
  elastalert_config: |-
    ---
    rules_folder: /opt/rules       # 指定规则的目录
    scan_subdirectories: false
    run_every:                     # 多久从 ES 中查询一次
      minutes: 1
    buffer_time:
      minutes: 15
    es_host: elaticsearch-svc-external.public-service
    es_port: 9200
    es_username: elastic
    es_password: elastic
    writeback_index: elastalert
    use_ssl: False
    verify_certs: True
    alert_time_limit:             # 失败重试限制
      minutes: 2880
---
apiVersion: v1
kind: ConfigMap
metadata:
  name: elastalert-rules
  namespace: logging
  labels:
    app: elastalert
data:
  rule_config.yaml: |-
    name: dummylogs error     # 规则名字,唯一值
    es_host: elaticsearch-svc-external.public-service
    es_port: 9200
    es_user: elastic
    es_password: elastic
    type: any                 # 报警类型
    index: k8s-*              # es索引

    filter:                   # 过滤
    - query:
        query_string:
          query: "level:ERROR"  # 报警条件

    alert:                    # 报警类型
    - "email"
    smtp_host: smtp.qq.com
    smtp_port: 587
    smtp_auth_file: /opt/auth/smtp_auth_file.yaml
    email_reply_to: xxx@qq.com
    from_addr: xxx@qq.com
    email:                  # 接受邮箱
    - "xx@xx.com"
---
apiVersion: apps/v1
kind: Deployment
metadata:
  name: elastalert
  namespace: logging
  labels:
    app: elastalert
spec:
  selector:
    matchLabels:
      app: elastalert
  template:
    metadata:
      labels:
        app: elastalert
    spec:
      nodeSelector:
        logging: "true"
      containers:
      - name: elastalert
        image: jertel/elastalert-docker:0.2.4
        imagePullPolicy: IfNotPresent
        volumeMounts:
        - name: config
          mountPath: /opt/config
        - name: rules
          mountPath: /opt/rules
        - name: auth
          mountPath: /opt/auth
        resources:
          limits:
            cpu: 50m
            memory: 256Mi
          requests:
            cpu: 50m
            memory: 256Mi
      volumes:
      - name: auth
        secret:
          secretName: smtp-auth
      - name: rules
        configMap:
          name: elastalert-rules
      - name: config
        configMap:
          name: elastalert-config
          items:
          - key: elastalert_config
            path: elastalert_config.yaml
使用邮件进行报警的时候,需要指定一个 smtp_auth_file 的文件,文件中包含用户名和密码:(smtp_auth_file.yaml)
user: "xxxxx"       # 发送的邮箱地址
password: "cwzknocmolvvbbji"   # 不是qq邮箱的登录密码,是授权码
开通qq第三方客户端授权码:https://service.mail.qq.com/cgi-bin/help?subtype=1&&id=28&&no=1001256
kubectl create secret generic smtp-auth --from-file=smtp_auth_file.yaml -n logging
创建上面的 elastalert 应用
# kubectl create -f elastalert.yaml

# kubectl get pod -n logging | grep elast
elastalert-fb86bd644-tcbxk            1/1     Running   0          13m

# kubectl logs -f elastalert-fb86bd644-tcbxk -n logging
Elastic Version: 7.8.0
Reading Elastic 6 index mappings:
Reading index mapping 'es_mappings/6/silence.json'
Reading index mapping 'es_mappings/6/elastalert_status.json'
Reading index mapping 'es_mappings/6/elastalert.json'
Reading index mapping 'es_mappings/6/past_elastalert.json'
Reading index mapping 'es_mappings/6/elastalert_error.json'
Index elastalert already exists. Skipping index creation.
查看elasticsearch中新增的index

产生ERROR级别的日志后收到的邮箱信息