本文讲解如何用DNN模型拟合一条二次曲线
导库
import tensorflow as tf
from tensorflow.keras import models,layers
import numpy as np
import os
import matplotlib.pyplot as plt
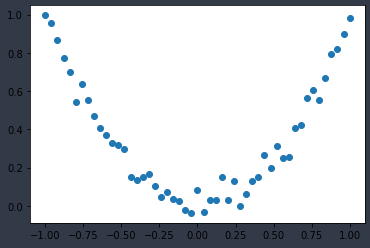
创建训练样本并绘图
x = np.linspace(-1,1,51)[:,np.newaxis]  # x是样本的特征,注意x是二维numpy数组,其中的每个一维数组用于存放一个样本(特征)
noise = np.random.normal(0,0.1,size=x.shape)  # 噪声
y = np.power(x,2) + 0.5*noise  # y是样本的标签,注意y也是二维numpy数组,其中的每个一维数组用于存放一个样本(标签)
plt.scatter(x,y)  # 绘图
plt.show()
创建神经网络并训练
drop_rate = 0.01
net = models.Sequential()
net.add(layers.Dense(50,activation='relu',input_shape=(1,)))
net.add(layers.Dropout(drop_rate))
net.add(layers.Dense(50,activation='relu'))
net.add(layers.Dropout(drop_rate))
net.add(layers.Dense(1))
adam = tf.keras.optimizers.Adam(lr=0.01,beta_1=0.9,beta_2=0.999,amsgrad=False)
net.compile(optimizer=adam,loss='mse')
history = net.fit(x,y,epochs=200,batch_size=10,shuffle=True,verbose=2)
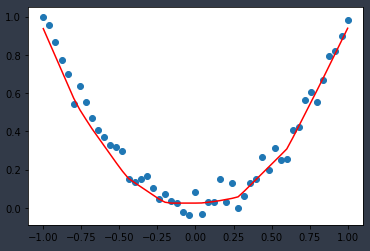
神经网络预测结果绘图
y_ = net.predict(x)
plt.scatter(x,y)
plt.plot(x,y_,color='r')
plt.show()
全部代码如下
import tensorflow as tf
from tensorflow.keras import models,layers
import numpy as np
import os
import matplotlib.pyplot as plt

x = np.linspace(-1,1,51)[:,np.newaxis]  # x是样本的特征,注意x是二维numpy数组,其中的每个一维数组用于存放一个样本(特征)
noise = np.random.normal(0,0.1,size=x.shape)  # 噪声
y = np.power(x,2) + 0.5*noise  # y是样本的标签,注意y也是二维numpy数组,其中的每个一维数组用于存放一个样本(标签)
plt.scatter(x,y)  # 绘图
plt.show()

drop_rate = 0.01
net = models.Sequential()
net.add(layers.Dense(50,activation='relu',input_shape=(1,)))
net.add(layers.Dropout(drop_rate))
net.add(layers.Dense(50,activation='relu'))
net.add(layers.Dropout(drop_rate))
net.add(layers.Dense(1))
adam = tf.keras.optimizers.Adam(lr=0.01,beta_1=0.9,beta_2=0.999,amsgrad=False)
net.compile(optimizer=adam,loss='mse')
history = net.fit(x,y,epochs=200,batch_size=10,shuffle=True,verbose=2)

y_ = net.predict(x)
plt.scatter(x,y)
plt.plot(x,y_,color='r')
plt.show()