Epplus 导出图表的 三个步骤
创建图表、选择数据、设置图表样式
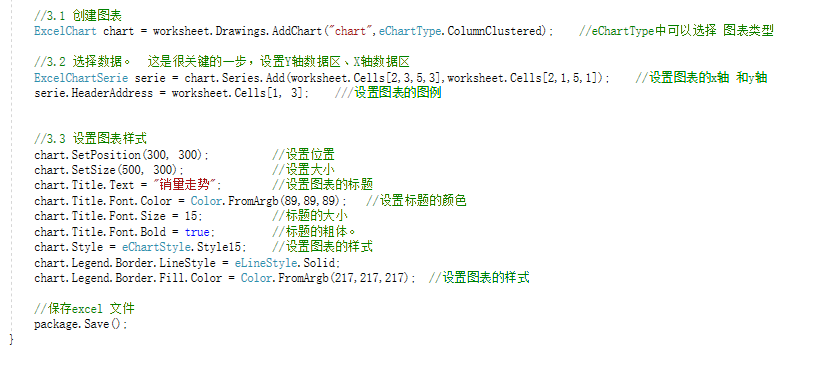
3.1 创建图表
3.2 选择数据。 这是很关键的一步,设置Y轴数据区、X轴数据区
3.3 设置图表样式

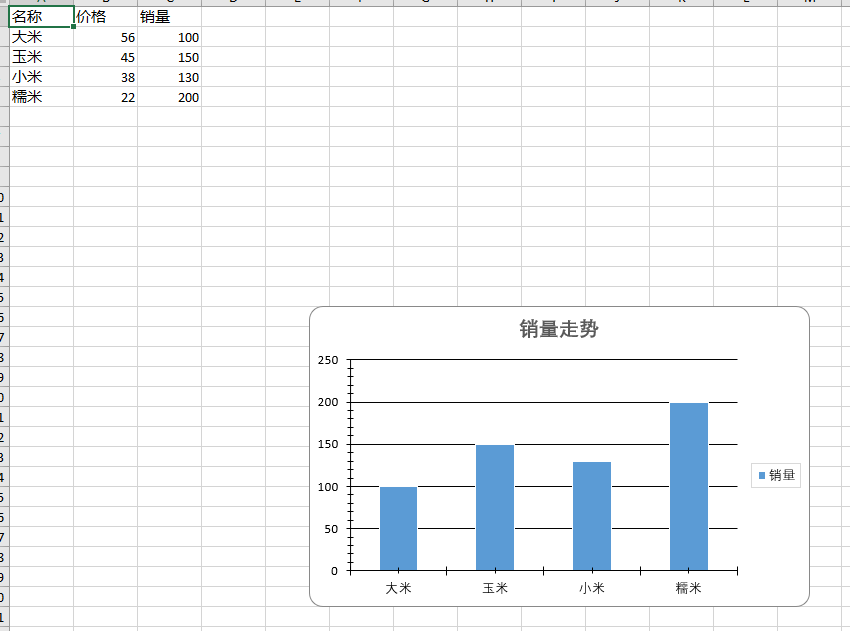
导出结果:
参考文献:
导出Excel之Epplus使用教程3(图表设置) - Wico - 博客园 (cnblogs.com)
导出Excel之Epplus使用教程3(图表设置)
Epplus的图表实现是很简单的,它支持的图表类型也很多,基本上能满足我们的需求。创建图表分为三步(以柱状图举例):
1、创建图表
|
1
|
ExcelChart chart = worksheet.Drawings.AddChart("chart", eChartType.ColumnClustered);//eChartType中可以选择图表类型 |
2、选择数据
这一步是很关键的一步,chart.Series.Add()方法所需参数为:chart.Series.Add(Y轴数据区,X轴数据区)
|
1
2
|
ExcelChartSerie serie = chart.Series.Add(worksheet.Cells[2, 3, 5, 3], worksheet.Cells[2, 1, 5, 1]);//设置图表的x轴和y轴serie.HeaderAddress = worksheet.Cells[1, 3];//设置图表的图例 |
3、设置图表样式
|
1
2
3
4
5
6
7
8
9
|
chart.SetPosition(150, 10);//设置位置chart.SetSize(500, 300);//设置大小chart.Title.Text = "销量走势";//设置图表的标题chart.Title.Font.Color = Color.FromArgb(89, 89, 89);//设置标题的颜色chart.Title.Font.Size = 15;//标题的大小chart.Title.Font.Bold = true;//标题的粗体chart.Style = eChartStyle.Style15;//设置图表的样式chart.Legend.Border.LineStyle = eLineStyle.Solid;chart.Legend.Border.Fill.Color = Color.FromArgb(217, 217, 217);//设置图例的样式 |
基本上生成图表就这么些东西了,不过不同的图表属性可能略有差异,得根据具体图表具体分析。
下面是例子的全部代码:


 FileInfo newFile = new FileInfo(@"d:	est.xlsx");
            if (newFile.Exists)
            {
                newFile.Delete();
                newFile = new FileInfo(@"d:	est.xlsx");
            }
            using (ExcelPackage package = new ExcelPackage(newFile))
            {
                ExcelWorksheet worksheet = package.Workbook.Worksheets.Add("test");

                worksheet.Cells.Style.WrapText = true;
                worksheet.View.ShowGridLines = false;//去掉sheet的网格线

                worksheet.Cells[1, 1].Value = "名称";
                worksheet.Cells[1, 2].Value = "价格";
                worksheet.Cells[1, 3].Value = "销量";

                worksheet.Cells[2, 1].Value = "大米";
                worksheet.Cells[2, 2].Value = 56;
                worksheet.Cells[2, 3].Value = 100;

                worksheet.Cells[3, 1].Value = "玉米";
                worksheet.Cells[3, 2].Value = 45;
                worksheet.Cells[3, 3].Value = 150;

                worksheet.Cells[4, 1].Value = "小米";
                worksheet.Cells[4, 2].Value = 38;
                worksheet.Cells[4, 3].Value = 130;

                worksheet.Cells[5, 1].Value = "糯米";
                worksheet.Cells[5, 2].Value = 22;
                worksheet.Cells[5, 3].Value = 200;

                using (ExcelRange range = worksheet.Cells[1, 1, 5, 3])
                {
                    range.Style.HorizontalAlignment = ExcelHorizontalAlignment.Center;
                    range.Style.VerticalAlignment = ExcelVerticalAlignment.Center;
                }

                using (ExcelRange range = worksheet.Cells[1, 1, 1, 3])
                {
                    range.Style.Font.Bold = true;
                    range.Style.Font.Color.SetColor(Color.White);
                    range.Style.Font.Name = "微软雅黑";
                    range.Style.Font.Size = 12;
                    range.Style.Fill.PatternType = ExcelFillStyle.Solid;
                    range.Style.Fill.BackgroundColor.SetColor(Color.FromArgb(128, 128, 128));
                }

                worksheet.Cells[1, 1].Style.Border.BorderAround(ExcelBorderStyle.Thin, Color.FromArgb(191, 191, 191));
                worksheet.Cells[1, 2].Style.Border.BorderAround(ExcelBorderStyle.Thin, Color.FromArgb(191, 191, 191));
                worksheet.Cells[1, 3].Style.Border.BorderAround(ExcelBorderStyle.Thin, Color.FromArgb(191, 191, 191));

                worksheet.Cells[2, 1].Style.Border.BorderAround(ExcelBorderStyle.Thin, Color.FromArgb(191, 191, 191));
                worksheet.Cells[2, 2].Style.Border.BorderAround(ExcelBorderStyle.Thin, Color.FromArgb(191, 191, 191));
                worksheet.Cells[2, 3].Style.Border.BorderAround(ExcelBorderStyle.Thin, Color.FromArgb(191, 191, 191));

                worksheet.Cells[3, 1].Style.Border.BorderAround(ExcelBorderStyle.Thin, Color.FromArgb(191, 191, 191));
                worksheet.Cells[3, 2].Style.Border.BorderAround(ExcelBorderStyle.Thin, Color.FromArgb(191, 191, 191));
                worksheet.Cells[3, 3].Style.Border.BorderAround(ExcelBorderStyle.Thin, Color.FromArgb(191, 191, 191));

                worksheet.Cells[4, 1].Style.Border.BorderAround(ExcelBorderStyle.Thin, Color.FromArgb(191, 191, 191));
                worksheet.Cells[4, 2].Style.Border.BorderAround(ExcelBorderStyle.Thin, Color.FromArgb(191, 191, 191));
                worksheet.Cells[4, 3].Style.Border.BorderAround(ExcelBorderStyle.Thin, Color.FromArgb(191, 191, 191));

                worksheet.Cells[5, 1].Style.Border.BorderAround(ExcelBorderStyle.Thin, Color.FromArgb(191, 191, 191));
                worksheet.Cells[5, 2].Style.Border.BorderAround(ExcelBorderStyle.Thin, Color.FromArgb(191, 191, 191));
                worksheet.Cells[5, 3].Style.Border.BorderAround(ExcelBorderStyle.Thin, Color.FromArgb(191, 191, 191));

                ExcelChart chart = worksheet.Drawings.AddChart("chart", eChartType.ColumnClustered);

                ExcelChartSerie serie = chart.Series.Add(worksheet.Cells[2, 3, 5, 3], worksheet.Cells[2, 1, 5, 1]);
                serie.HeaderAddress = worksheet.Cells[1, 3];

                chart.SetPosition(150, 10);
                chart.SetSize(500, 300);
                chart.Title.Text = "销量走势";
                chart.Title.Font.Color = Color.FromArgb(89, 89, 89);
                chart.Title.Font.Size = 15;
                chart.Title.Font.Bold = true;
                chart.Style = eChartStyle.Style15;
                chart.Legend.Border.LineStyle = eLineStyle.Solid;
                chart.Legend.Border.Fill.Color = Color.FromArgb(217, 217, 217);

                package.Save();
            }