一个高性能并且功能比较全面的profiler库,async-profiler 【Github地址】,可以作为 JProfiler 的开源替代。
async-profiler 提供了 CPU 热点分析,内存分配采样分析,锁分析,时钟分析,和Java函数(包括JVM native 函数)分析等功能,也提供了分析结果作为火焰图输出。
如何读懂火焰图参考阮一峰的博客 http://www.ruanyifeng.com/blog/2017/09/flame-graph.html
async-profiler 也提供了比较方便的启动脚本,比如要采样分析30s内的CPU热点
./profiler.sh -e cpu -d 30 pid
使用 list 命令可以查看当前环境支持的分析事件,例如
./profiler.sh list pid

## output
Basic events:
  cpu
  alloc
  lock
  wall
  itimer
Java method calls:
  ClassName.methodName
Perf events:
  page-faults
  context-switches
  cycles
  instructions
  cache-references
  cache-misses
  branch-instructions
  branch-misses
  bus-cycles
  L1-dcache-load-misses
  LLC-load-misses
  dTLB-load-misses
  rNNN
  pmu/event-descriptor/
  mem:breakpoint
  trace:tracepoint
  kprobe:func
  uprobe:path
提供了一个oss的加速地址,
首先进入控制台,下载和解压 async-profiler
curl -o async-profiler-2.5-linux-x64.tar.gz https://terminus-dice.oss-cn-hangzhou.aliyuncs.com/spot/java-agent/async-profiler/async-profiler-2.5-linux-x64.tar.gz

tar -zxvf async-profiler-2.5-linux-x64.tar.gz && cd async-profiler-2.5-linux-x64
然后 jps 查看 java 的进程 pid
jps

## output
1 app.jar
149 Jps
执行 cpu 热点分析 ( 示例为进行 30秒的数据采样,根据实际场景可以调整诊断周期
./profiler.sh -e cpu -d 30 1

## output
Profiling for 30 seconds

...

## ns 表示诊断周期内采样到的函数执行时间
## percent 表示该函数的占比
## samples 表示函数被采样到的次数

          ns  percent  samples  top
  ----------  -------  -------  ---
  1170069916    3.55%      115  java_lang_Throwable::fill_in_stack_trace(Handle, methodHandle, Thread*)
  1080180566    3.28%      106  CodeHeap::find_start(void*) const
   979428580    2.97%       97  BacktraceBuilder::push(Method*, int, Thread*)
   820367658    2.49%       70  IndexSetIterator::advance_and_next()
   770204785    2.34%       74  OopMapSet::update_register_map(frame const*, RegisterMap*)
   659625965    2.00%       63  _IO_vfprintf_internal
   600066241    1.82%       59  frame::sender(RegisterMap*) const
   559994122    1.70%       55  PhaseChaitin::Split(unsigned int, ResourceArea*)
   500089045    1.52%       48  java.util.regex.Pattern$Slice.match
   470039625    1.43%       45  vframeArray::allocate(JavaThread*, int, GrowableArray<compiledVFrame*>*, RegisterMap*, frame, frame, frame, bool)
   430450575    1.31%       41  _int_malloc
   409666771    1.24%       40  sun.net.www.ParseUtil.encodePath
   400089494    1.21%       39  resource_allocate_bytes(unsigned long, AllocFailStrategy::AllocFailEnum)
   380146025    1.15%       37  pthread_getspecific
   371189901    1.13%       36  PhaseChaitin::interfere_with_live(unsigned int, IndexSet*)
   360380475    1.09%       32  Deoptimization::fetch_unroll_info_helper(JavaThread*)
   360090466    1.09%       35  jshort_disjoint_arraycopy
   310034456    0.94%       31  RegisterMap::RegisterMap(RegisterMap const*)
   280047136    0.85%       27  org.springframework.boot.loader.jar.JarFileEntries.getEntry
   280007669    0.85%       28  CodeCache::find_blob(void*)
   270352542    0.82%       27  _int_free
   270065077    0.82%       26  nmethod::is_zombie() const
   260038542    0.79%       25  __libc_malloc
执行内存分配分析 ( 示例为进行 30秒的数据采样,根据实际场景可以调整诊断周期
./profiler.sh -e alloc -d 30 1

# output
Profiling for 30 seconds

...

## bytes 表示诊断周期内该类型触发分配的总字节数
## percent 表示诊断周期内该类型触发分配的总字节数占诊断周期内JVM分配总内存的比例
## samples 表示该类型被采样到次数

     bytes  percent  samples  top
  ----------  -------  -------  ---
    31107144   51.79%      171  char[]
     5745504    9.57%       16  java.util.concurrent.locks.AbstractQueuedSynchronizer$Node
     4189704    6.98%        9  int[]
     3390448    5.65%       47  byte[]
     3234784    5.39%       11  java.lang.String
     1518048    2.53%        4  org.dozer.event.DozerEvent
     1497888    2.49%        6  java.util.ArrayList$Itr
     1319992    2.20%        6  java.util.HashMap$Node
      922816    1.54%        1  java.util.regex.Pattern$Slice
      890656    1.48%        3  java.lang.StringBuilder
      759208    1.26%        2  java.lang.Object[]
      618472    1.03%        1  org.springframework.boot.loader.jar.JarURLConnection
      383064    0.64%        1  java.lang.String[]
      379536    0.63%        1  org.springframework.asm.Label
      379528    0.63%        1  org.springframework.asm.Item
      379520    0.63%        1  java.nio.HeapCharBuffer
      379520    0.63%        1  java.nio.HeapByteBuffer
      379504    0.63%        1  java.util.LinkedList
      379496    0.63%        1  java.util.LinkedList$Node
      379496    0.63%        1  org.springframework.boot.loader.jar.JarURLConnection$JarEntryName
      379496    0.63%        1  java.lang.Class[]
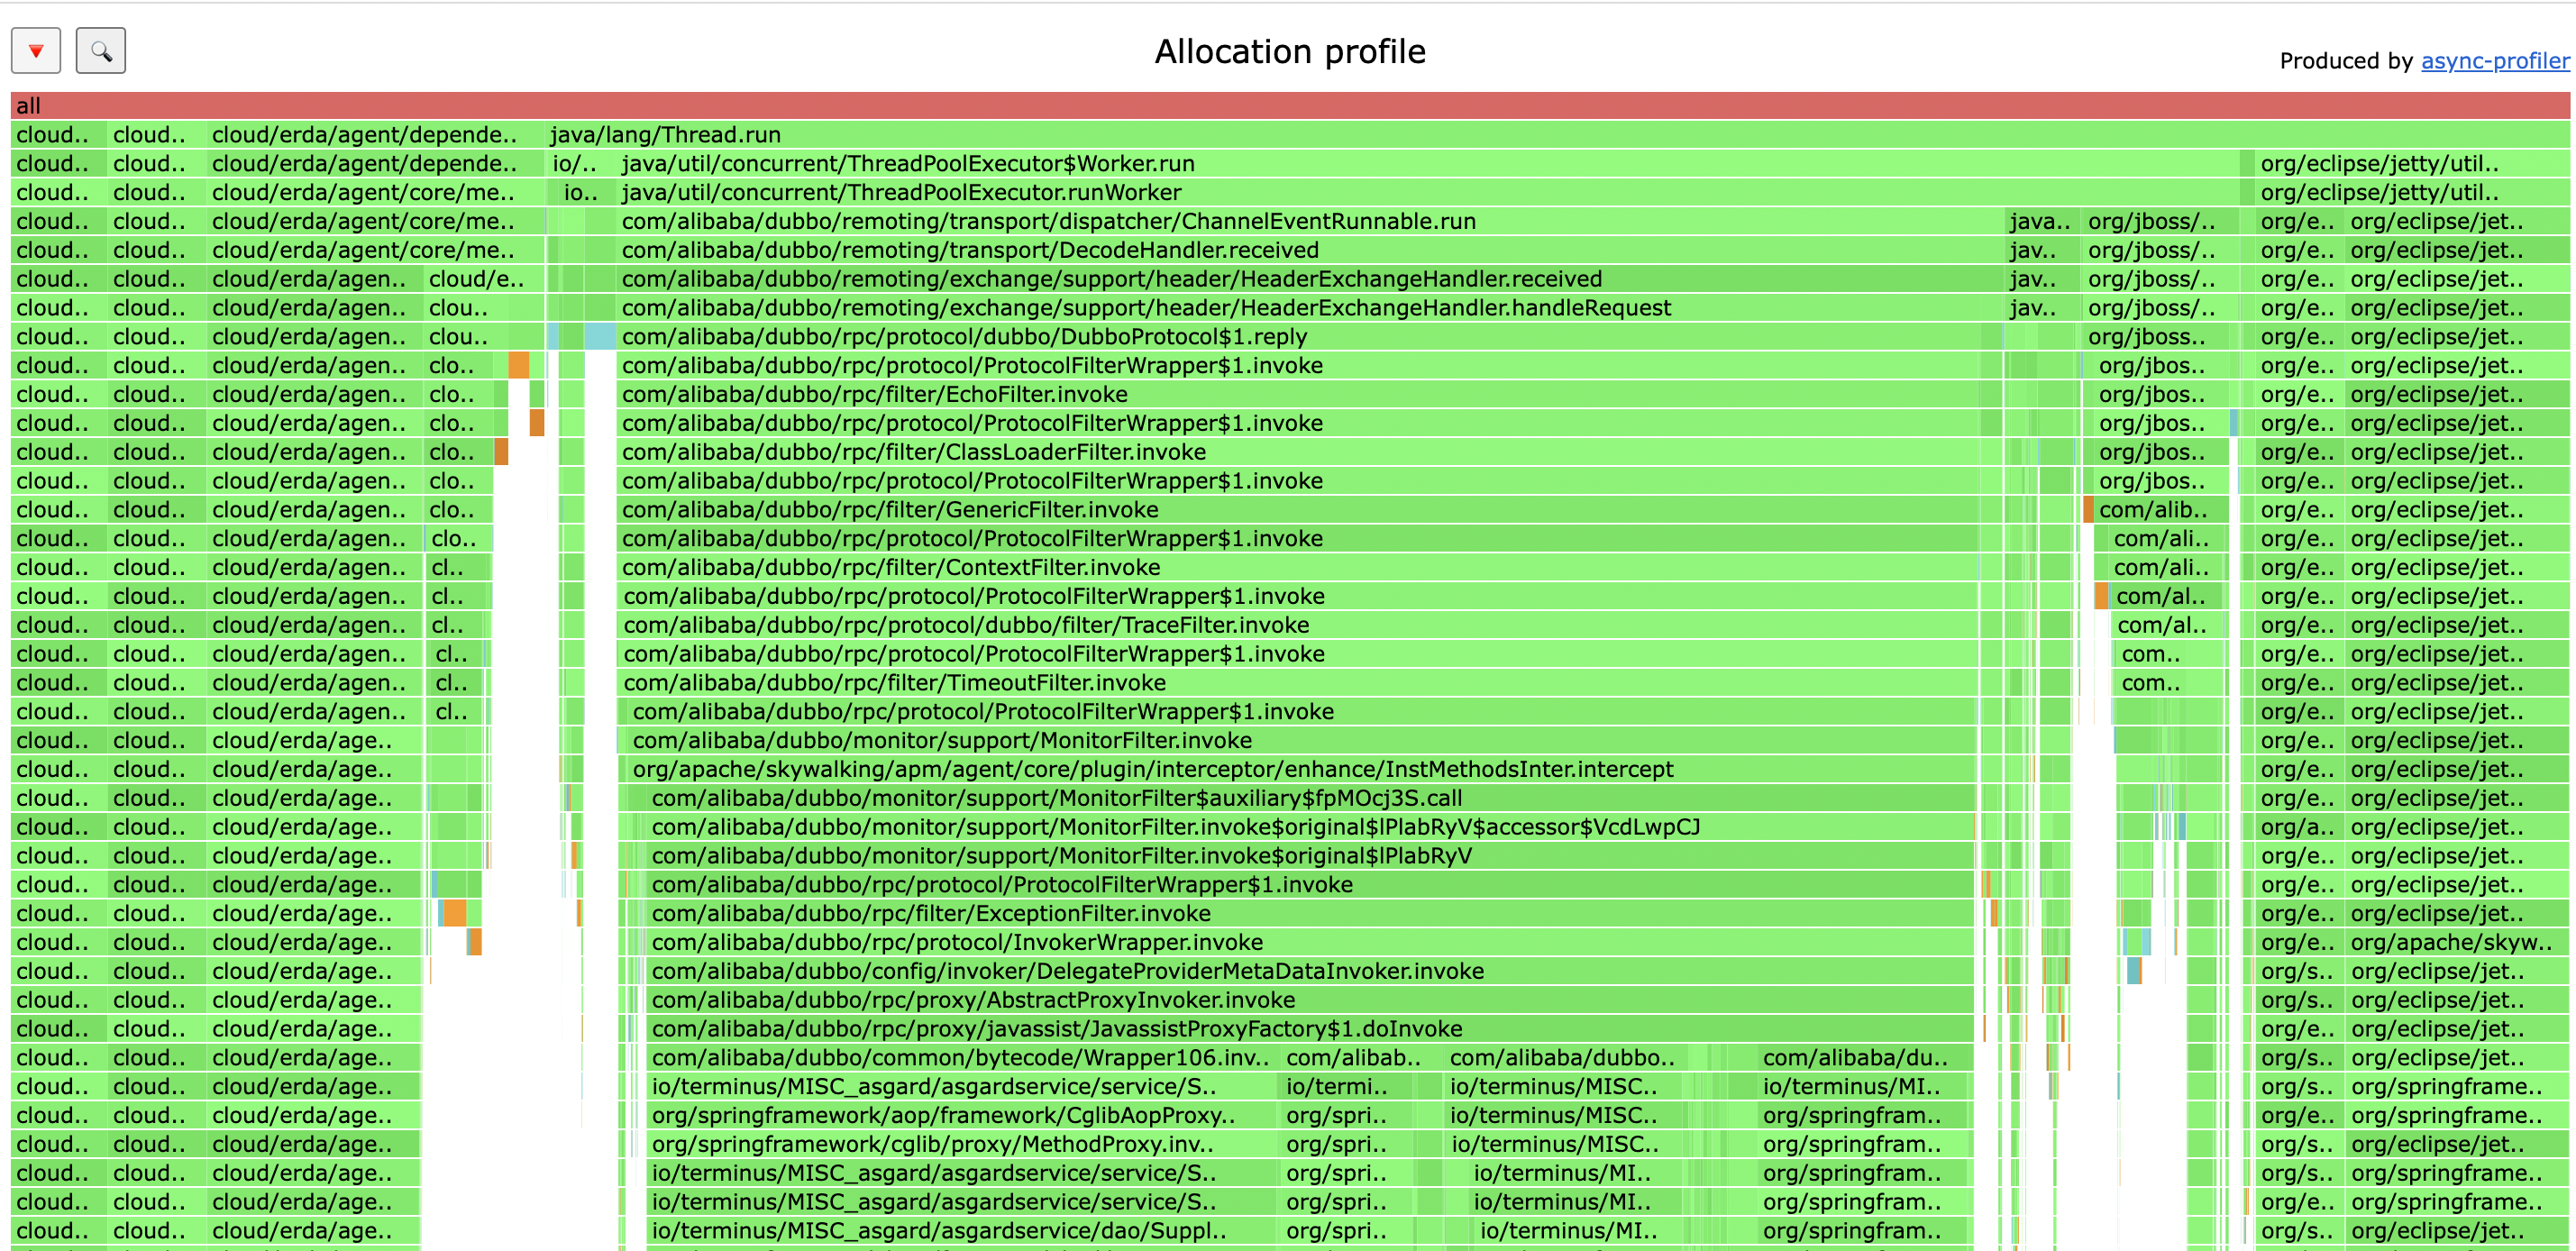
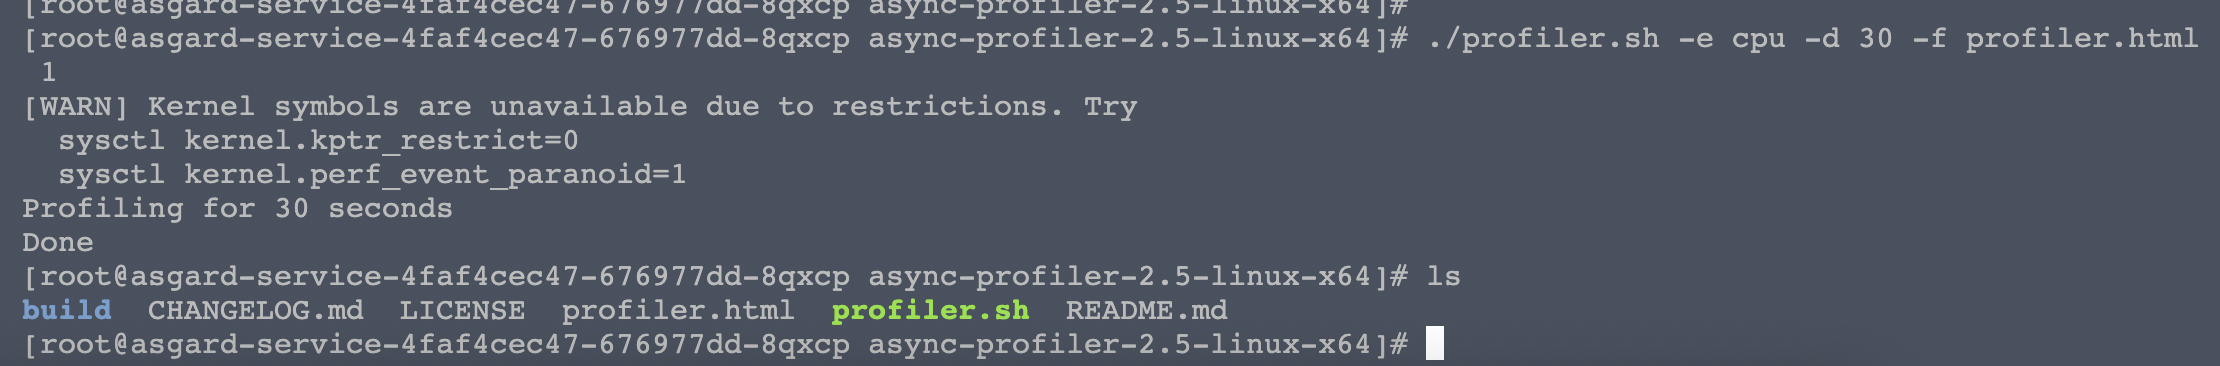
使用 -f profiler.html 参数输出火焰图,比如
./profiler.sh -e cpu -d 30 -f profiler.html 1
在容器内生成火焰图文件
火焰图打开效果