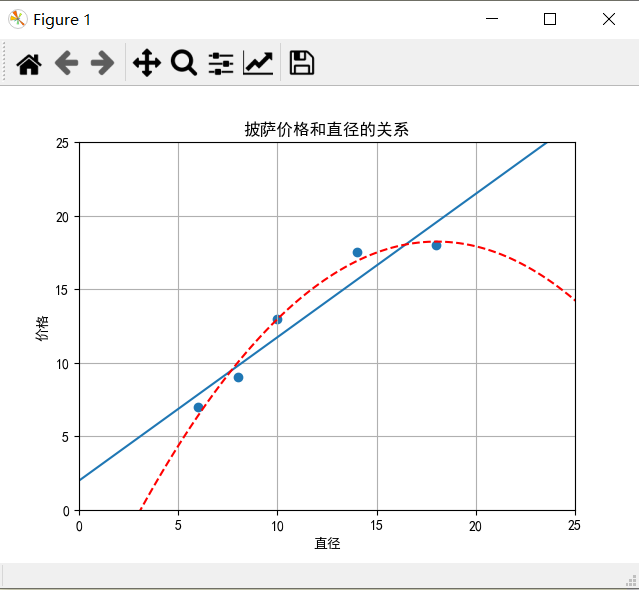
我们仍然使用披萨直径的价格的数据
import matplotlib
matplotlib.rcParams['font.sans-serif']=[u'simHei']
matplotlib.rcParams['axes.unicode_minus']=False
import numpy as np
import pandas as pd
import matplotlib.pyplot as plt
from sklearn.linear_model import LinearRegression
from sklearn.preprocessing import PolynomialFeatures

X_train = [[6],[8],[10],[14],[18]]
y_train = [[7],[9],[13],[17.5],[18]]
X_test = [[6],[8],[11],[16]]
y_test = [[8],[12],[15],[18]]

LR = LinearRegression()
LR.fit(X_train,y_train)

xx = np.linspace(0,26,100)
yy = LR.predict(xx.reshape(xx.shape[0],1))
plt.plot(xx,yy)
二阶多项式回归
# In[1] 二次回归,二阶多项式回归
#PolynomialFeatures转换器可以用于为一个特征表示增加多项式特征
quadratic_featurizer = PolynomialFeatures(degree=2)
X_train_quadratic = quadratic_featurizer.fit_transform(X_train)
X_test_quadratic = quadratic_featurizer.transform(X_test)

regressor_quadratic = LinearRegression()
regressor_quadratic.fit(X_train_quadratic,y_train)

xx_quadratic = quadratic_featurizer.transform(xx.reshape(xx.shape[0],1))
yy_quadratic = regressor_quadratic.predict(xx_quadratic)
plt.plot(xx,yy_quadratic,c='r',linestyle='--')
# In[2] 图参数,输出结果
plt.title("披萨价格和直径的关系")
plt.xlabel("直径")
plt.ylabel("价格")
plt.axis([0,25,0,25])
plt.grid(True)
plt.scatter(X_train,y_train)

print("X_train
",X_train)
print("X_train_quadratic
",X_train_quadratic)
print("X_test
",X_test)
print("X_test_quadratic
",X_test_quadratic)
print("简单线性规划R方",LR.score(X_test,y_test))
print("二阶多项式回归R方",regressor_quadratic.score(X_test_quadratic,y_test))

X_train
 [[6], [8], [10], [14], [18]]
X_train_quadratic
 [[  1.   6.  36.]
 [  1.   8.  64.]
 [  1.  10. 100.]
 [  1.  14. 196.]
 [  1.  18. 324.]]
X_test
 [[6], [8], [11], [16]]
X_test_quadratic
 [[  1.   6.  36.]
 [  1.   8.  64.]
 [  1.  11. 121.]
 [  1.  16. 256.]]
简单线性规划R方 0.809726797707665
三阶多项式回归
# In[3] 尝试三阶多项式回归
cubic_featurizer = PolynomialFeatures(degree=3)
X_train_cubic = cubic_featurizer.fit_transform(X_train)
X_test_cubic = cubic_featurizer.transform(X_test)

regressor_cubic = LinearRegression()
regressor_cubic.fit(X_train_cubic,y_train)

xx_cubic = cubic_featurizer.transform(xx.reshape(xx.shape[0],1))
yy_cubic = regressor_cubic.predict(xx_cubic)
plt.plot(xx,yy_cubic,c='g',linestyle='--')
plt.show()

print("X_train
",X_train)
print("X_train_cubic
",X_train_cubic)
print("X_test
",X_test)
print("X_test_cubic
",X_test_cubic)
print("三阶多项式回归R方",regressor_cubic.score(X_test_cubic,y_test))

X_train
 [[6], [8], [10], [14], [18]]
X_train_cubic
 [[1.000e+00 6.000e+00 3.600e+01 2.160e+02]
 [1.000e+00 8.000e+00 6.400e+01 5.120e+02]
 [1.000e+00 1.000e+01 1.000e+02 1.000e+03]
 [1.000e+00 1.400e+01 1.960e+02 2.744e+03]
 [1.000e+00 1.800e+01 3.240e+02 5.832e+03]]
X_test
 [[6], [8], [11], [16]]
X_test_cubic
 [[1.000e+00 6.000e+00 3.600e+01 2.160e+02]
 [1.000e+00 8.000e+00 6.400e+01 5.120e+02]
 [1.000e+00 1.100e+01 1.210e+02 1.331e+03]
 [1.000e+00 1.600e+01 2.560e+02 4.096e+03]]
三阶多项式回归R方 0.8356924156036954
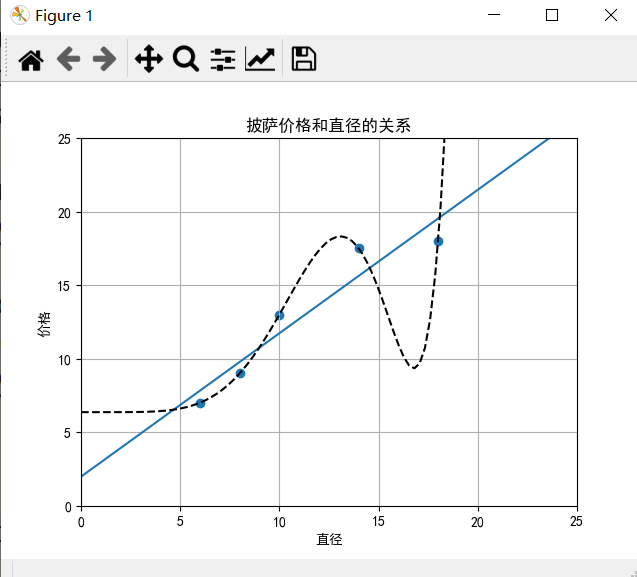
九阶多项式回归
# In[4] 尝试九阶多项式回归
nine_featurizer = PolynomialFeatures(degree=9)
X_train_nine = nine_featurizer.fit_transform(X_train)
X_test_nine = nine_featurizer.transform(X_test)

regressor_nine = LinearRegression()
regressor_nine.fit(X_train_nine,y_train)

xx_nine = nine_featurizer.transform(xx.reshape(xx.shape[0],1))
yy_nine = regressor_nine.predict(xx_nine)
plt.plot(xx,yy_nine,c='k',linestyle='--')
plt.show()

print("X_train
",X_train)
print("X_train_nine
",X_train_nine)
print("X_test
",X_test)
print("X_test_nine
",X_test_nine)
print("九阶多项式回归R方",regressor_nine.score(X_test_nine,y_test))

X_train
 [[6], [8], [10], [14], [18]]
X_train_nine
 [[1.00000000e+00 6.00000000e+00 3.60000000e+01 2.16000000e+02
  1.29600000e+03 7.77600000e+03 4.66560000e+04 2.79936000e+05
  1.67961600e+06 1.00776960e+07]
 [1.00000000e+00 8.00000000e+00 6.40000000e+01 5.12000000e+02
  4.09600000e+03 3.27680000e+04 2.62144000e+05 2.09715200e+06
  1.67772160e+07 1.34217728e+08]
 [1.00000000e+00 1.00000000e+01 1.00000000e+02 1.00000000e+03
  1.00000000e+04 1.00000000e+05 1.00000000e+06 1.00000000e+07
  1.00000000e+08 1.00000000e+09]
 [1.00000000e+00 1.40000000e+01 1.96000000e+02 2.74400000e+03
  3.84160000e+04 5.37824000e+05 7.52953600e+06 1.05413504e+08
  1.47578906e+09 2.06610468e+10]
 [1.00000000e+00 1.80000000e+01 3.24000000e+02 5.83200000e+03
  1.04976000e+05 1.88956800e+06 3.40122240e+07 6.12220032e+08
  1.10199606e+10 1.98359290e+11]]
X_test
 [[6], [8], [11], [16]]
X_test_nine
 [[1.00000000e+00 6.00000000e+00 3.60000000e+01 2.16000000e+02
  1.29600000e+03 7.77600000e+03 4.66560000e+04 2.79936000e+05
  1.67961600e+06 1.00776960e+07]
 [1.00000000e+00 8.00000000e+00 6.40000000e+01 5.12000000e+02
  4.09600000e+03 3.27680000e+04 2.62144000e+05 2.09715200e+06
  1.67772160e+07 1.34217728e+08]
 [1.00000000e+00 1.10000000e+01 1.21000000e+02 1.33100000e+03
  1.46410000e+04 1.61051000e+05 1.77156100e+06 1.94871710e+07
  2.14358881e+08 2.35794769e+09]
 [1.00000000e+00 1.60000000e+01 2.56000000e+02 4.09600000e+03
  6.55360000e+04 1.04857600e+06 1.67772160e+07 2.68435456e+08
  4.29496730e+09 6.87194767e+10]]
九阶多项式回归R方 -0.09435666704291412
所有代码
# -*- coding: utf-8 -*-
import matplotlib
matplotlib.rcParams['font.sans-serif']=[u'simHei']
matplotlib.rcParams['axes.unicode_minus']=False
import numpy as np
import pandas as pd
import matplotlib.pyplot as plt
from sklearn.linear_model import LinearRegression
from sklearn.preprocessing import PolynomialFeatures

X_train = [[6],[8],[10],[14],[18]]
y_train = [[7],[9],[13],[17.5],[18]]
X_test = [[6],[8],[11],[16]]
y_test = [[8],[12],[15],[18]]

LR = LinearRegression()
LR.fit(X_train,y_train)

xx = np.linspace(0,26,100)
yy = LR.predict(xx.reshape(xx.shape[0],1))
plt.plot(xx,yy)

# In[1] 二次回归,二阶多项式回归
#PolynomialFeatures转换器可以用于为一个特征表示增加多项式特征
quadratic_featurizer = PolynomialFeatures(degree=2)
X_train_quadratic = quadratic_featurizer.fit_transform(X_train)
X_test_quadratic = quadratic_featurizer.transform(X_test)

regressor_quadratic = LinearRegression()
regressor_quadratic.fit(X_train_quadratic,y_train)

xx_quadratic = quadratic_featurizer.transform(xx.reshape(xx.shape[0],1))
yy_quadratic = regressor_quadratic.predict(xx_quadratic)
plt.plot(xx,yy_quadratic,c='r',linestyle='--')

# In[2] 图参数,输出结果
plt.title("披萨价格和直径的关系")
plt.xlabel("直径")
plt.ylabel("价格")
plt.axis([0,25,0,25])
plt.grid(True)
plt.scatter(X_train,y_train)

print("X_train
",X_train)
print("X_train_quadratic
",X_train_quadratic)
print("X_test
",X_test)
print("X_test_quadratic
",X_test_quadratic)
print("简单线性规划R方",LR.score(X_test,y_test))
print("二阶多项式回归R方",regressor_quadratic.score(X_test_quadratic,y_test))

# In[3] 尝试三阶多项式回归
cubic_featurizer = PolynomialFeatures(degree=3)
X_train_cubic = cubic_featurizer.fit_transform(X_train)
X_test_cubic = cubic_featurizer.transform(X_test)

regressor_cubic = LinearRegression()
regressor_cubic.fit(X_train_cubic,y_train)

xx_cubic = cubic_featurizer.transform(xx.reshape(xx.shape[0],1))
yy_cubic = regressor_cubic.predict(xx_cubic)
plt.plot(xx,yy_cubic,c='g',linestyle='--')
plt.show()

print("X_train
",X_train)
print("X_train_cubic
",X_train_cubic)
print("X_test
",X_test)
print("X_test_cubic
",X_test_cubic)
print("三阶多项式回归R方",regressor_cubic.score(X_test_cubic,y_test))

# In[4] 尝试九阶多项式回归
nine_featurizer = PolynomialFeatures(degree=9)
X_train_nine = nine_featurizer.fit_transform(X_train)
X_test_nine = nine_featurizer.transform(X_test)

regressor_nine = LinearRegression()
regressor_nine.fit(X_train_nine,y_train)

xx_nine = nine_featurizer.transform(xx.reshape(xx.shape[0],1))
yy_nine = regressor_nine.predict(xx_nine)
plt.plot(xx,yy_nine,c='k',linestyle='--')
plt.show()

print("X_train
",X_train)
print("X_train_nine
",X_train_nine)
print("X_test
",X_test)
print("X_test_nine
",X_test_nine)
print("九阶多项式回归R方",regressor_nine.score(X_test_nine,y_test))
