目录
一、监控简介
监控就是实时的帮助我们来监控或者探测我们部署的服务是否正常运行。
常用的监控
- zabbix
  - 组件比较全,缺点:性能不高
  - 当zabbix监控大型集群的时候,怎么优化
  - 当数据库中一个表中数据超过2000w的时候,数据库的性能急剧下降
- 阿里云云监控
- 腾讯云蓝鲸监控
- 普罗米修斯(prometheus)
  - 性能比较高,底层使用(时序数据库)
  - 原生支持监控容器
普罗米修斯(prometheus)
普罗米修斯监控分为两种情况:
 1、携带metrics接口的服务(kubernetes、ETCD、Docker)

 2、不携带metrics接口的服务(Nginx、mysql、Linux主机),针对于不携带metrics接口的服务,我们需要安装一个exporter插件。
二、部署prometheus
1.prometheus主机上部署软件
# 下载
[root@prometheus opt]# wget https://github.com/prometheus/prometheus/releases/download/v2.27.1/prometheus-2.27.1.linux-amd64.tar.gz
或者 wget https://github.com/prometheus/prometheus/releases/download/v2.25.0/prometheus-2.25.0.linux-amd64.tar.gz
# 解压
[root@prometheus opt]# tar -xf prometheus-2.27.1.linux-amd64.tar.gz -C /usr/local/
[root@prometheus ~]# cd /usr/local/
# 建立超链接
[root@prometheus local]# ln -s /usr/local/prometheus-2.27.1.linux-amd64 /usr/local/prometheus
[root@prometheus local]# ll
lrwxrwxrwx 1 root root 30 Jun 2 09:49 prometheus -> prometheus-2.25.0.linux-amd64/
# 创建环境变量
[root@prometheus local]# cat >> /etc/profile <<EOF
export PROMETHEUS_HOME=/usr/local/prometheus
PATH=$PATH:$PROMETHEUS_HOME
export PATH
EOF
#重载环境变量文件
[root@prometheus ~]# source /etc/profile
# 测试安装成功
[root@prometheus ~]# prometheus --version
prometheus, version 2.25.0 (branch: HEAD, revision: a6be548dbc17780d562a39c0e4bd0bd4c00ad6e2)
build user: root@615f028225c9
build date: 20210217-14:17:24
go version: go1.15.8
platform: linux/amd64
#查看配置文件(prometheus.yml)
[root@prometheus ~]# cd /usr/local/prometheus
[root@prometheus prometheus]# ll
total 167984
drwxr-xr-x 2 3434 3434 38 Feb 18 00:11 console_libraries
drwxr-xr-x 2 3434 3434 173 Feb 18 00:11 consoles
-rw-r--r-- 1 3434 3434 11357 Feb 18 00:11 LICENSE
-rw-r--r-- 1 3434 3434 3420 Feb 18 00:11 NOTICE
-rwxr-xr-x 1 3434 3434 91044140 Feb 17 22:19 prometheus
-rw-r--r-- 1 3434 3434 1170 Jun 2 18:16 prometheus.yml
-rwxr-xr-x 1 3434 3434 80948693 Feb 17 22:21 promtool
#启动prometheus
[root@prometheus ~]# prometheus --config.file=/usr/local/prometheus/prometheus.yml
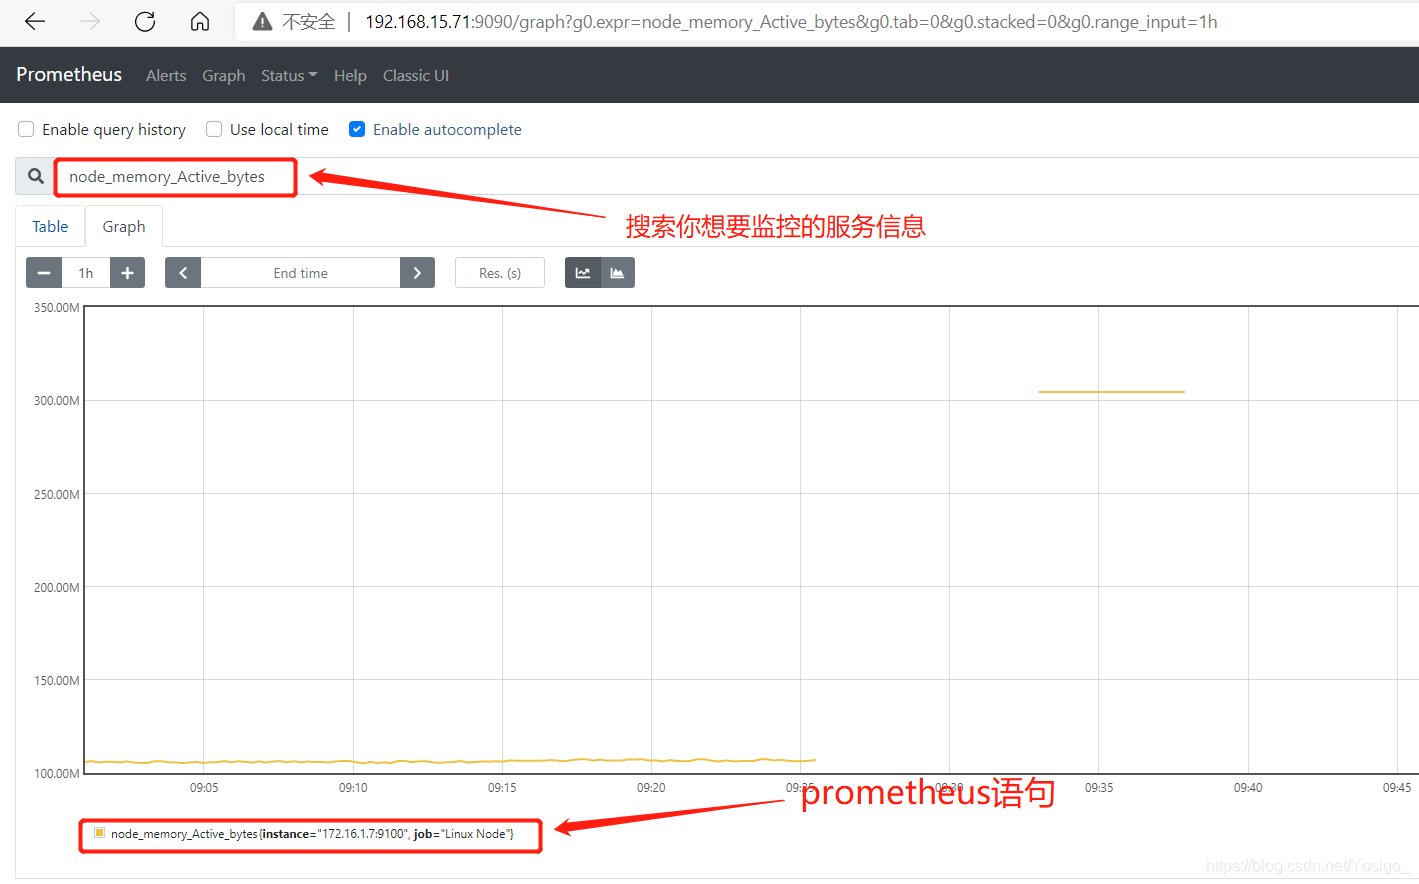
#访问查看是否监控
http://192.168.15.71:9090/targets
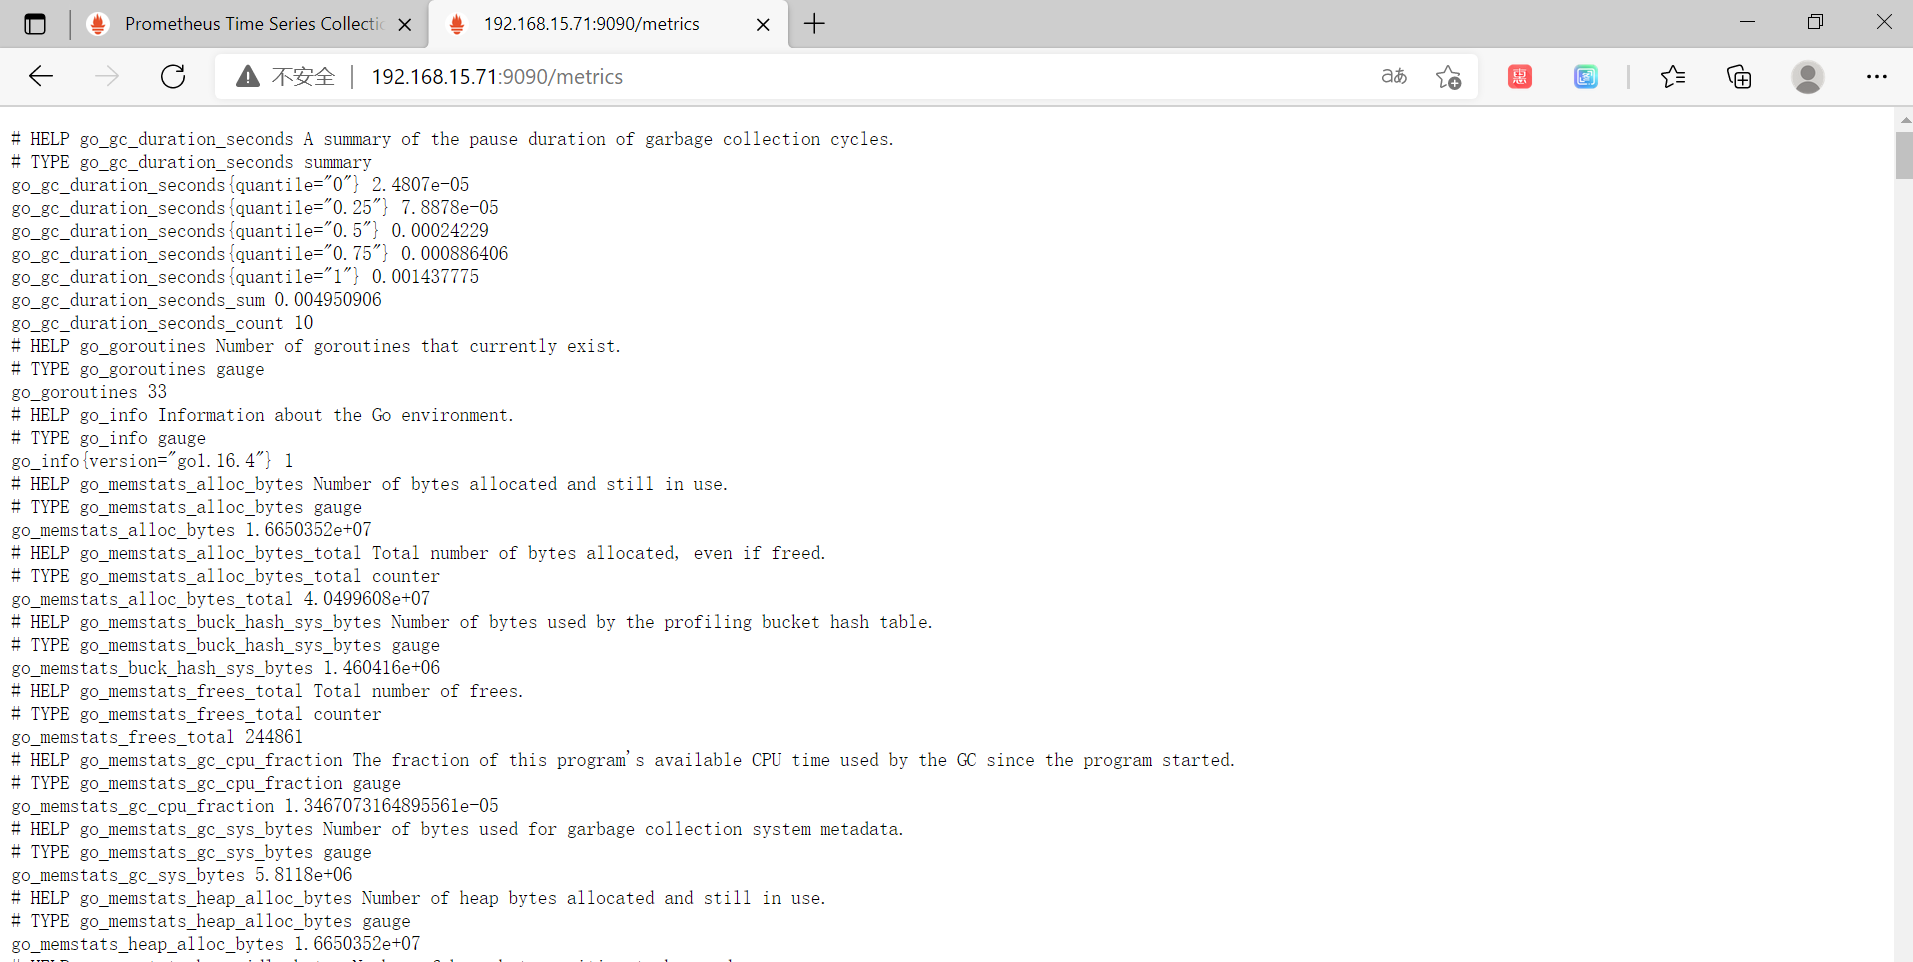
#查看接口数据
http://192.168.15.71:9090/metrics
#创建promethets的systemd启动文件"
cat >>/usr/lib/systemd/system/prometheus.service <<EOF
[Unit]
Description=https://prometheus.io
[Service]
Restart=on-failure
ExecStart=/usr/local/prometheus/prometheus --config.file=/usr/local/prometheus/prometheus.yml
[Install]
WantedBy=multi-user.target
EOF
#.启动promethets"
systemctl daemon-reload
systemctl enable --now prometheus.service

2.使用普罗米修斯监控Linux主机 (web集群)
# 下载
[root@web01 opt]# wget https://github.com/prometheus/node_exporter/releases/download/v1.1.2/node_exporter-1.1.2.linux-amd64.tar.gz

#解压
[root@web01 opt]# tar -xf node_exporter-1.1.2.linux-amd64.tar.gz -C /usr/local/
[root@prometheus ~]# cd /usr/local/

#建立软连接
[root@web01 local]# ln -s /usr/local/node_exporter-1.1.2.linux-amd64/ /usr/local/node_exporter

#添加环境变量
[root@web01 local]# vim /etc/profile
... ...
export NODE_EXPORTER=/usr/local/node_exporter
export PATH=$PATH:$NODE_EXPORTER

#重载配置文件
[root@web01 ~]# source /etc/profile

#启动prometheus监控(9100端口)
[root@web01 ~]# node_exporter
level=info ts=2021-06-02T07:01:08.509Z caller=node_exporter.go:195 msg="Listening on" address=:9100

#创建systemd服务
cat > /etc/systemd/system/node_exporter.service <<EOF
[Unit]
Description=This is prometheus node exporter
After=node_exporter.service

[Service]
Type=simple
ExecStart=/usr/local/node_exporter/node_exporter
ExecReload=/bin/kill -HUP
KillMode=process
Restart=on-failure

[Install]
WantedBy=multi-user.target
EOF

#.启动node_exporter服务"
systemctl daemon-reload
systemctl enable --now node_exporter.service

参数:
	--web.listen-address=":9100" 	#修改默认端口,防止冲突
	--web.telemetry-path="/metrics" #获取metric信息的url,默认是/metrics,若需要修改则通过此参数
    --log.level="info" 			    #设置日志级别
    --log.format="logger:stderr"     #设置打印日志的格式,若有自动化日志提取工具可以使用这个参数规范日志打印的格式
3.将Linux主机的exporter插件添加至Prometheus软件服务
[root@prometheus ~]# vim /usr/local/prometheus/prometheus.yml
- job_name: 'Linux Node' # 添加监控项的名字
static_configs:
- targets:
- "172.16.1.7:9100" # 监控主机的ip地址和端口号
- "172.16.1.8:9100"
- "172.16.1.9:9100"
#重载prometheus
[root@prometheus ~]# prometheus --config.file=/usr/local/prometheus/prometheus.yml
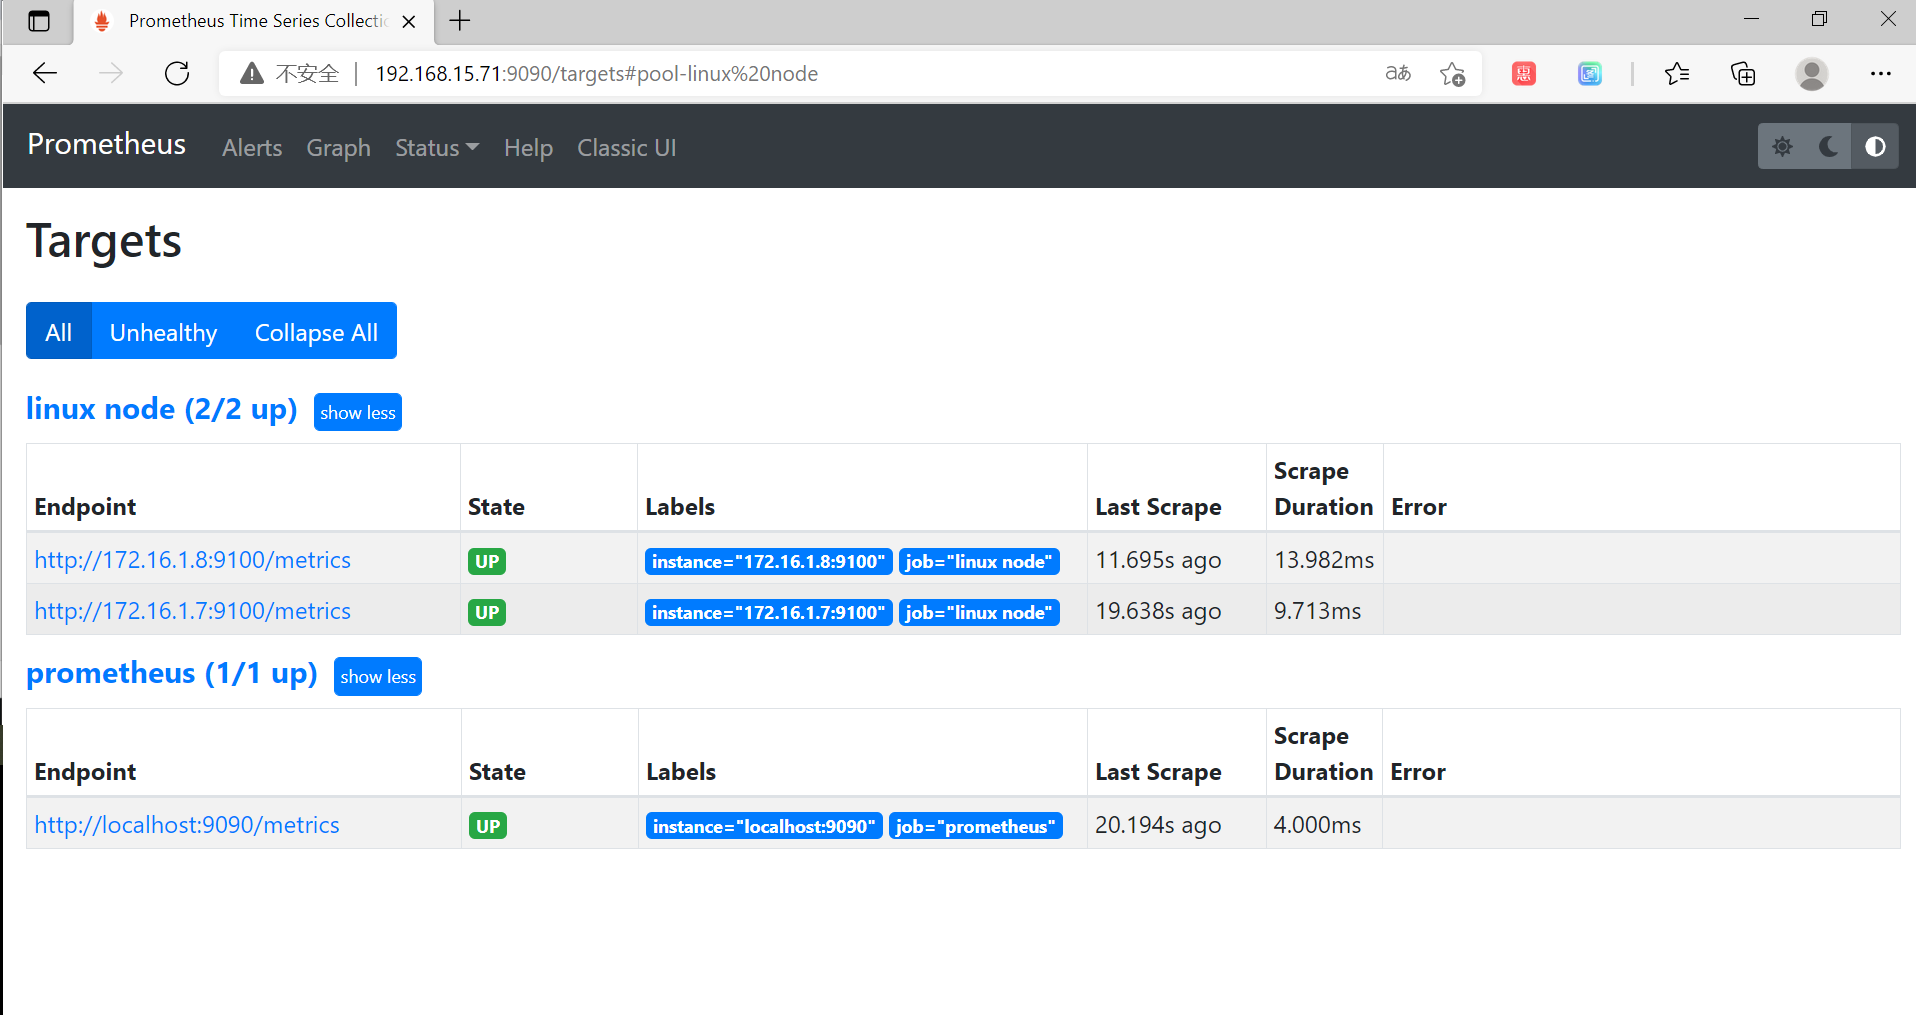
#访问查看是否监控
http://192.168.15.71:9090/targets
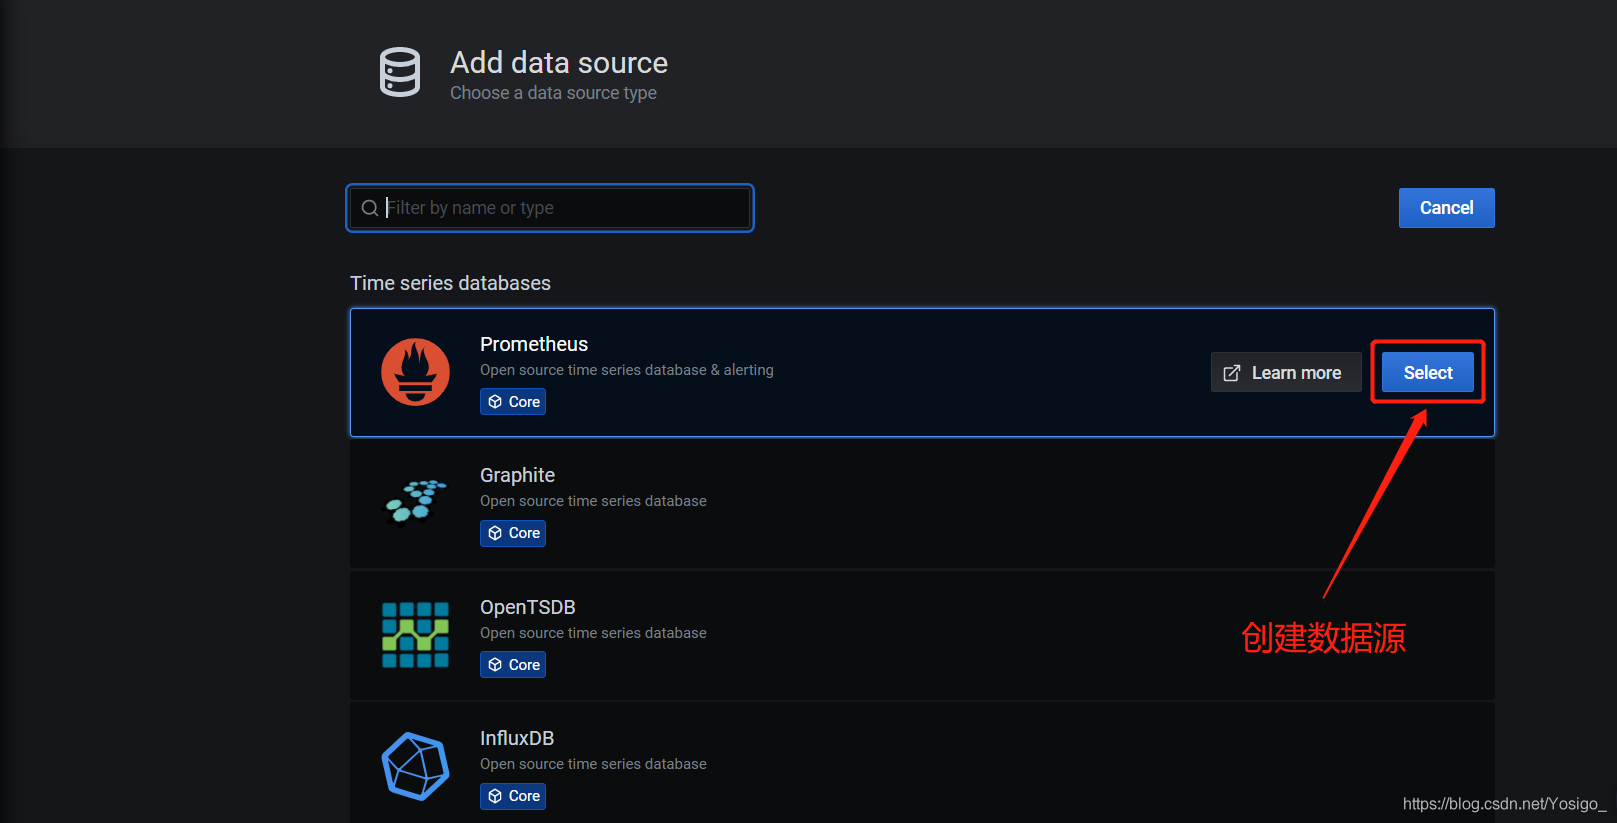
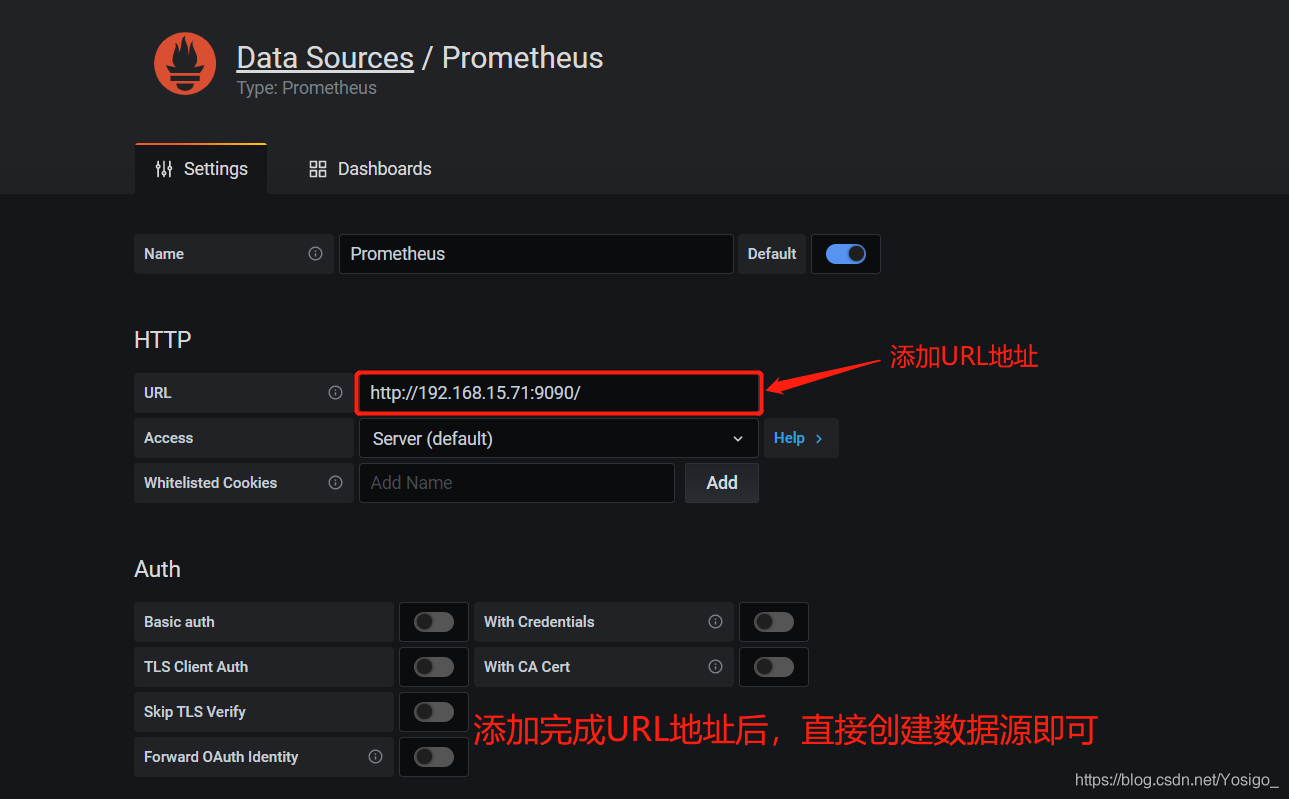
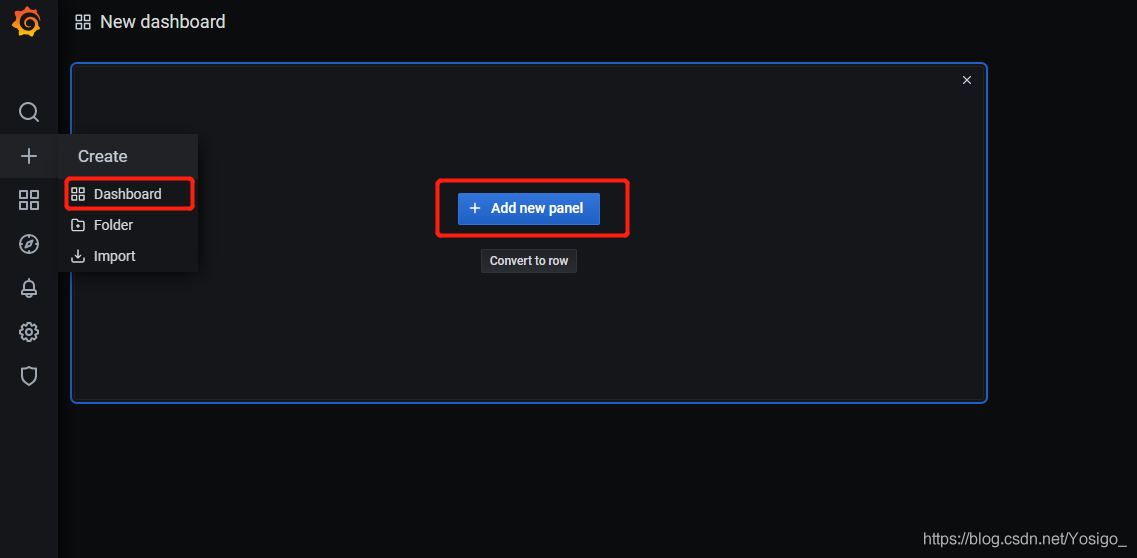
4.使用Garafana展示数据
Garafana是业内做数据展示挺好的一款产品
[root@prometheus opt]# rz -E rafana-7.3.6-1.x86_64.rpm

[root@prometheus opt]# yum install -y grafana-7.3.6-1.x86_64.rpm

[root@prometheus opt]# systemctl start grafana-server.service

[root@prometheus opt]# netstat -tnlp
tcp6       0      0 :::3000                 :::*                    LISTEN      10137/grafana-serve
#访问
HTTPS://192.168.15.71:3000
账号和密码默认是admin


监控Linux主机单个状态信息
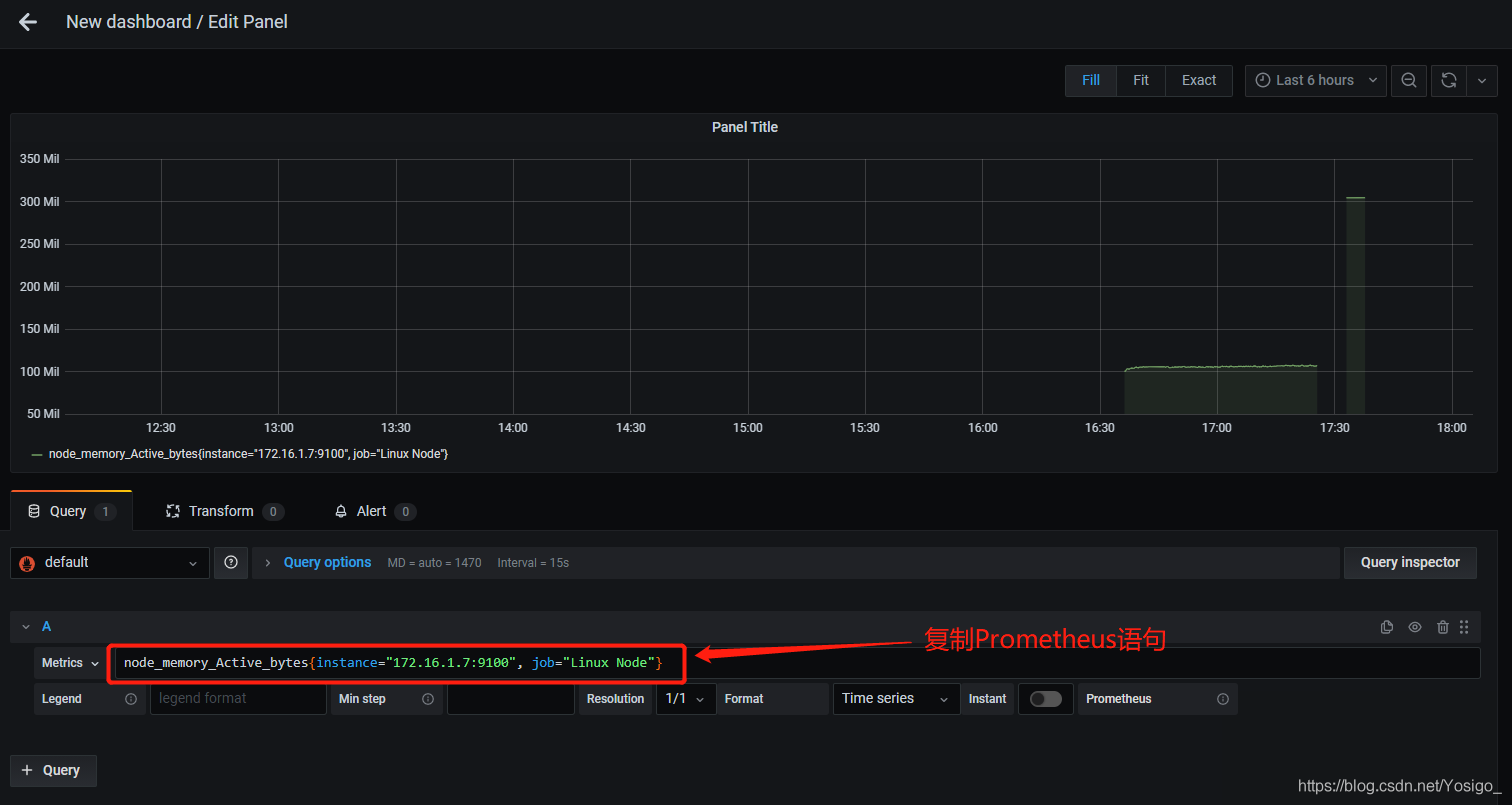
监控Linux主机整体的状态信息
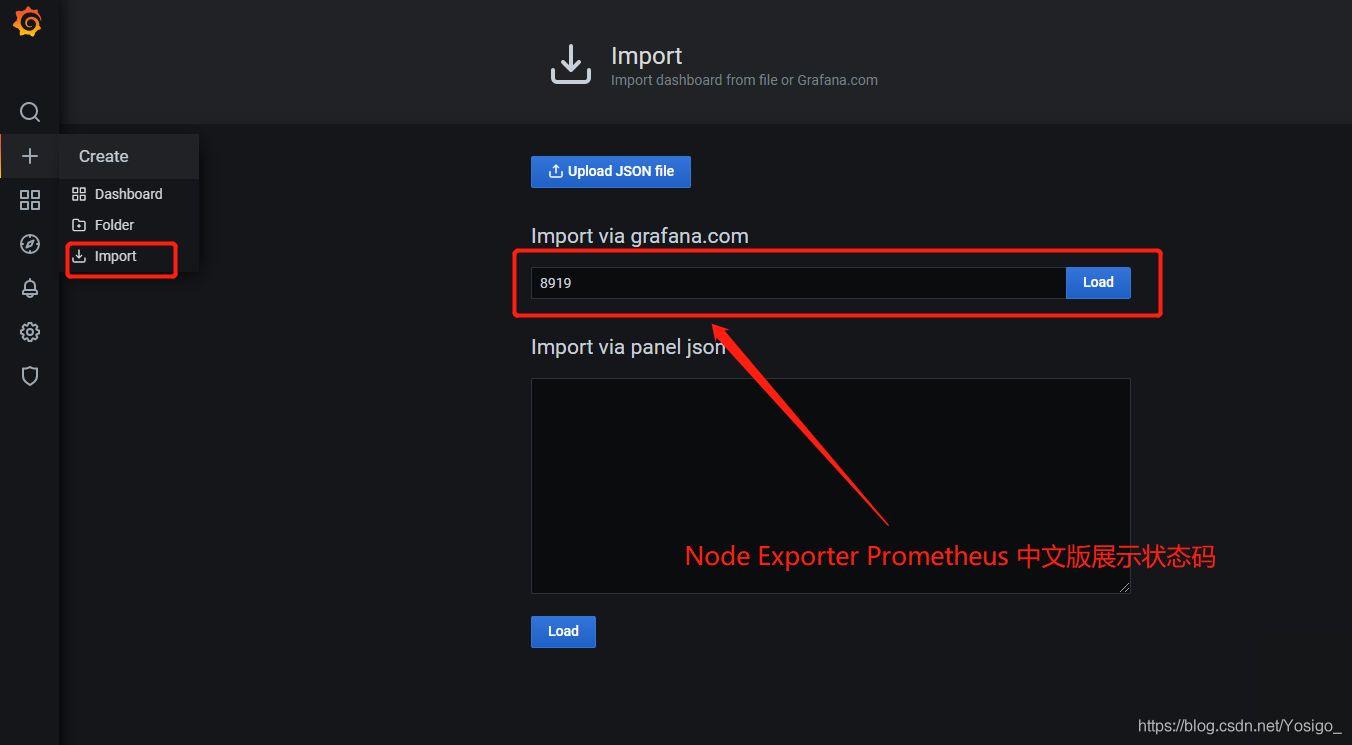
Prometheus各种展示页面状态码: https://grafana.com/grafana/dashboards?dataSource=prometheus
5.prometheus监控数据库
Prometheus监控Mysql数据库官网教程:https://github.com/prometheus/mysqld_exporter
#数据库的版本要求:
- mysql >= 5.6
- mariadb >= 10.2

#上传解压包
[root@db01 opt]# rz -E
-rw-r--r-- 1 root root 7121565 Apr 22 21:33 mysqld_exporter-0.12.1.linux-amd64.tar.gz
[root@db01 opt]# tar -xf mysqld_exporter-0.12.1.linux-amd64.tar.gz -C /usr/local/
[root@db01 opt]# cd /usr/local/
[root@db01 local]# ll
drwxr-xr-x  2 3434 3434 58 Jul 29  2019 mysqld_exporter-0.12.1.linux-amd64
#做软连接
[root@db01 local]# ln -s /usr/local/mysqld_exporter-0.12.1.linux-amd64/ /usr/local/mysqld_exporter

#创建用户并授权以及查看用户权限
[root@db01 ~]# mysql -uroot -p111

MariaDB [(none)]> create user 'exporter'@'%' identified by '123';
Query OK, 0 rows affected (0.01 sec)

MariaDB [(none)]> grant process, replication client, select on *.* to 'exporter'@'%';
Query OK, 0 rows affected (0.01 sec)

MariaDB [(none)]> use mysql;
Reading table information for completion of table and column names
You can turn off this feature to get a quicker startup with -A

Database changed
MariaDB [mysql]> select host,user from user;
+------------+----------+
| host       | user     |
+------------+----------+
| %          | exporter |
| 127.0.0.1  | root     |
| 172.16.1.% | www      |
| ::1        | root     |
| db01       |          |
| db01       | root     |
| localhost  |          |
| localhost  | root     |
+------------+----------+
8 rows in set (0.00 sec)

#添加文件
[root@db01 mysqld_exporter]# vim .my.cnf
[client]
host=172.16.1.51
user=exporter
password=123

#监控成功(9104端口)
[root@db01 mysqld_exporter]# ./mysqld_exporter  --config.my-cnf="/usr/local/mysqld_exporter/.my.cnf"
INFO[0000] Starting mysqld_exporter (version=0.12.1, branch=HEAD, revision=48667bf7c3b438b5e93b259f3d17b70a7c9aff96)  source="mysqld_exporter.go:257"
INFO[0000] Build context (go=go1.12.7, user=root@0b3e56a7bc0a, date=20190729-12:35:58)  source="mysqld_exporter.go:258"
INFO[0000] Enabled scrapers:
INFO[0000] Listening on :9104                            source="mysqld_exporter.go:283"
6.将Mysql主机的exporter插件添加至Prometheus软件服务
[root@prometheus ~]# vim /usr/local/prometheus/prometheus.yml
  - job_name: 'Mysql server'
    static_configs:
      - targets:
        - "172.16.1.51:9104"
#重载prometheus
[root@prometheus ~]# prometheus --config.file=/usr/local/prometheus/prometheus.yml

#创建systemdqldmysqld_exporter.service务"
cat >> /usr/lib/systemd/system/mysqld_exporter.service <<EOF
[Unit]
Description=Prometheus

[Service]
Environment=DATA_SOURCE_NAME=root:123@(172.16.1.18:3306)/
ExecStart=/usr/local/mysqld_exporter/mysqld_exporter --config.my-cnf=/usr/local/mysqld_exporter/.my.cnf --web.listen-address=:9104
Restart=on-failure

[Install]
WantedBy=multi-user.target
EOF

#启动node_exporter服务"
systemctl daemon-reload
systemctl enable --now mysqld_exporter.service

# 普罗米修斯是通过mysql_exporter来找mariadb进行获取数据的,所以要给它授权(用户名可自定义,与.my.cnf对应)
# (注意:授权ip为localhost,因为不是prometheus服务器来直接找mariadb 获取数据,而是prometheus服务器找mysql_exporter,mysql_exporter 再找mariadb。所以这个localhost是指的mysql_exporter的IP)
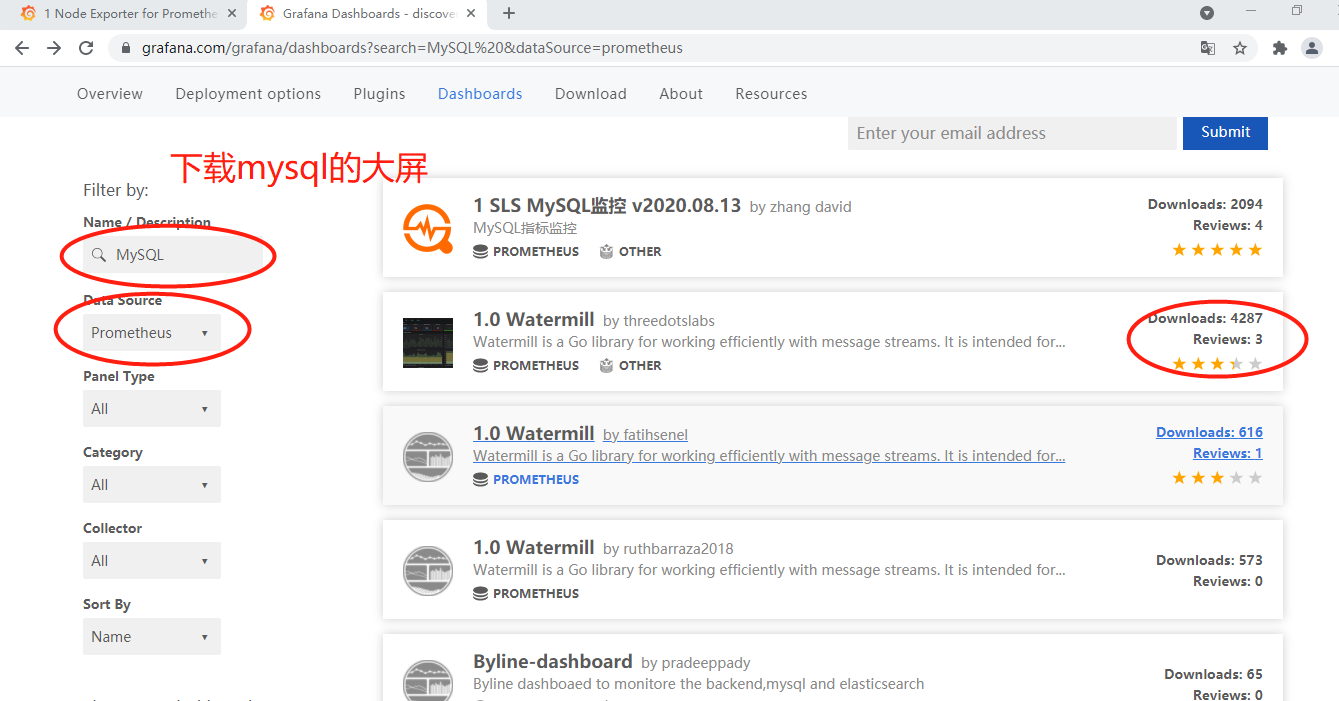
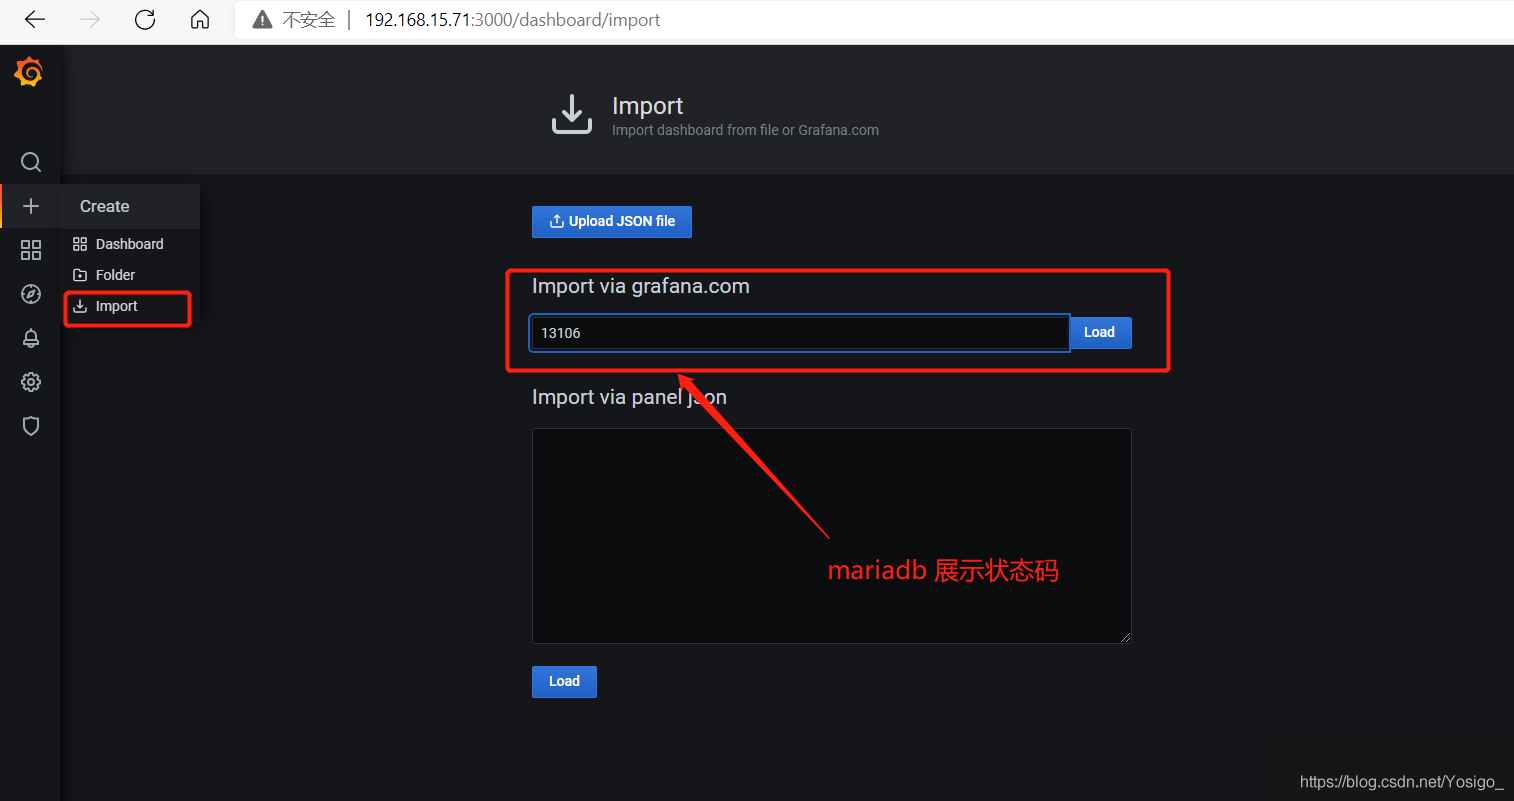
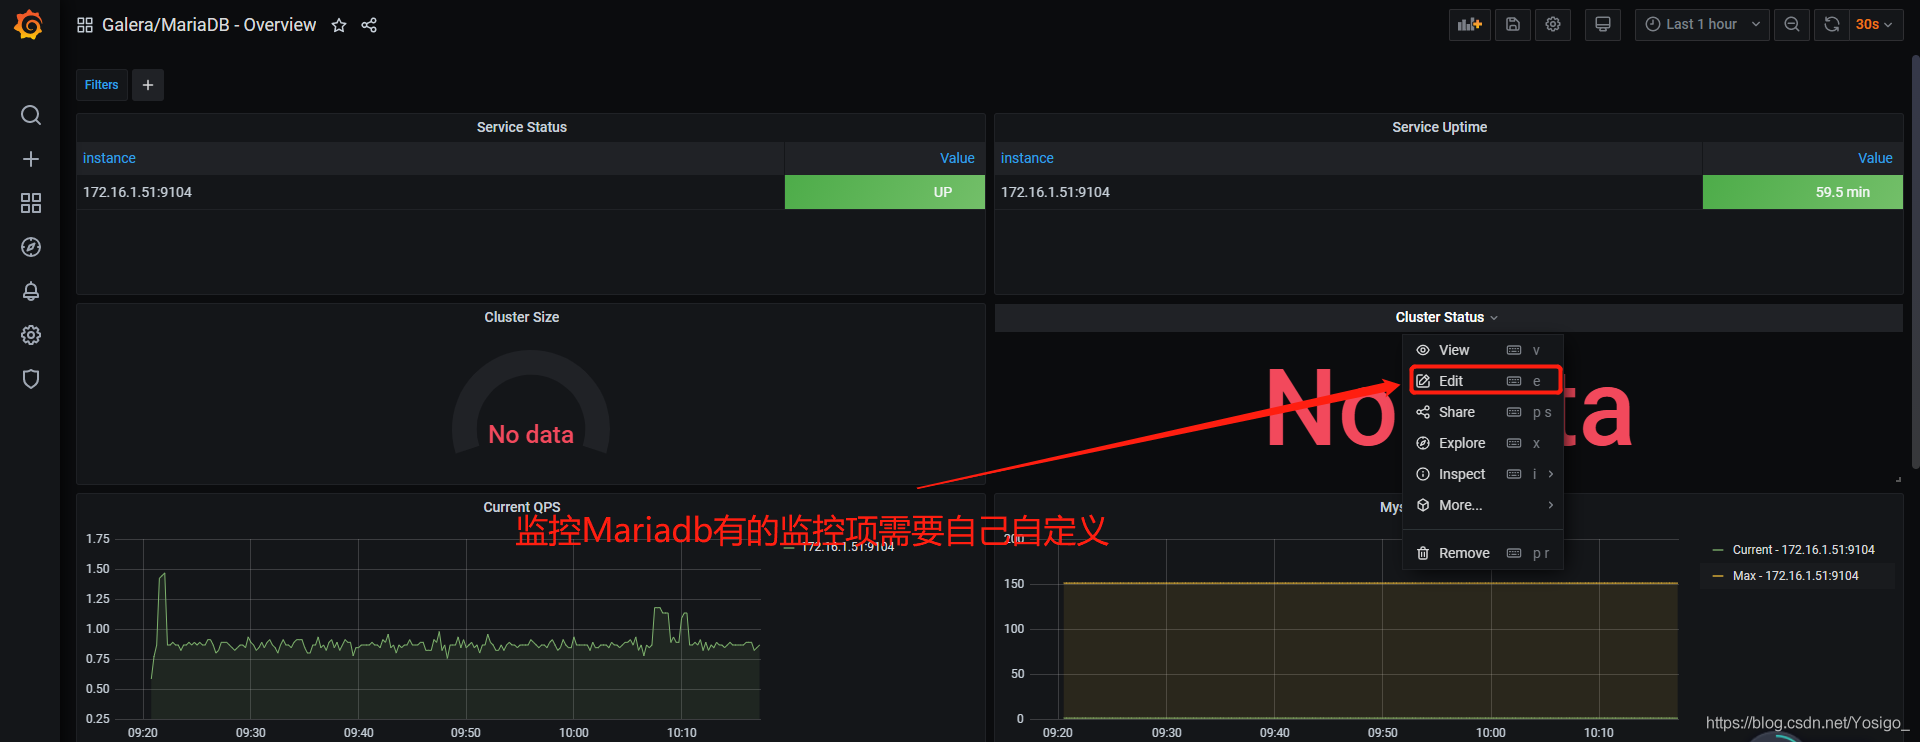
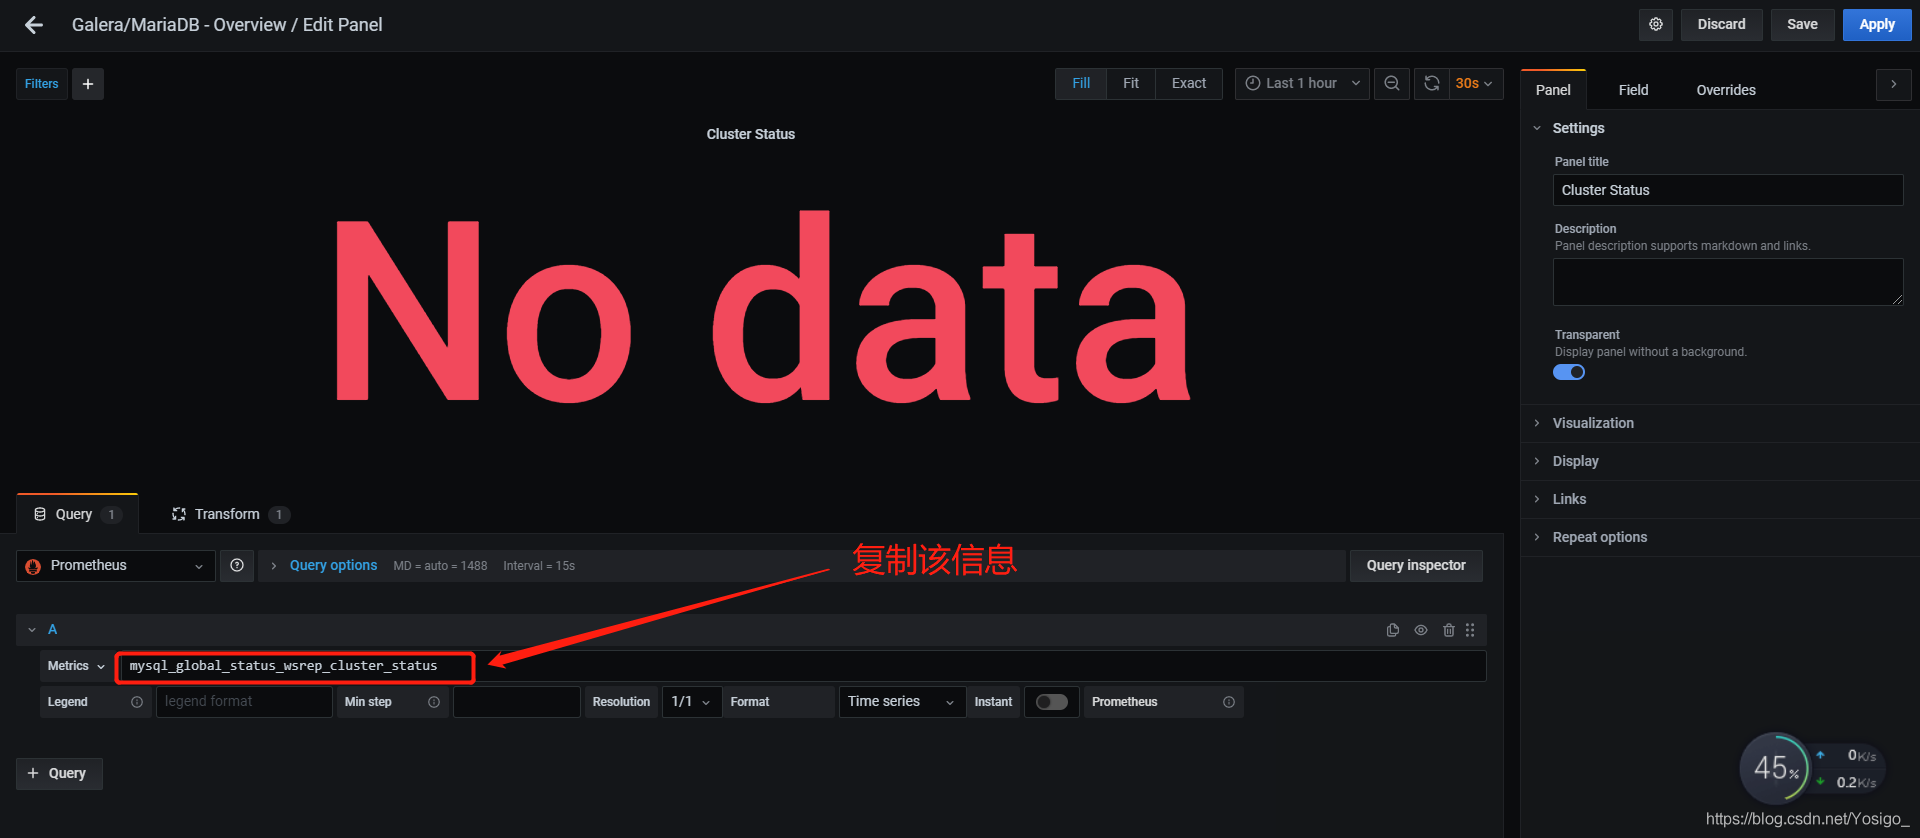
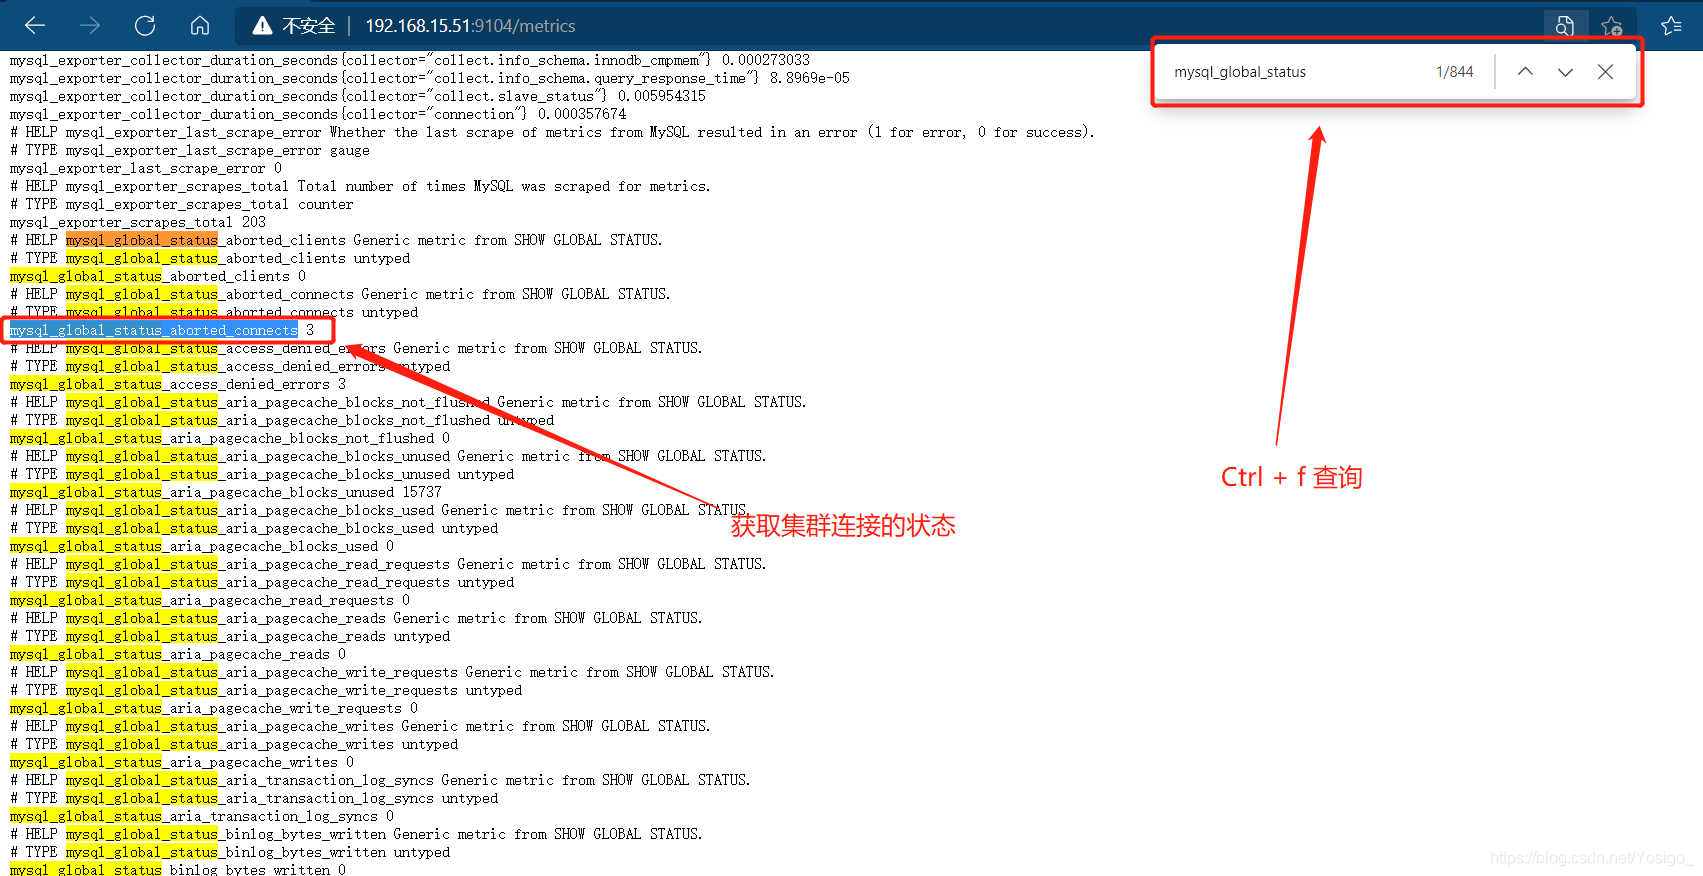
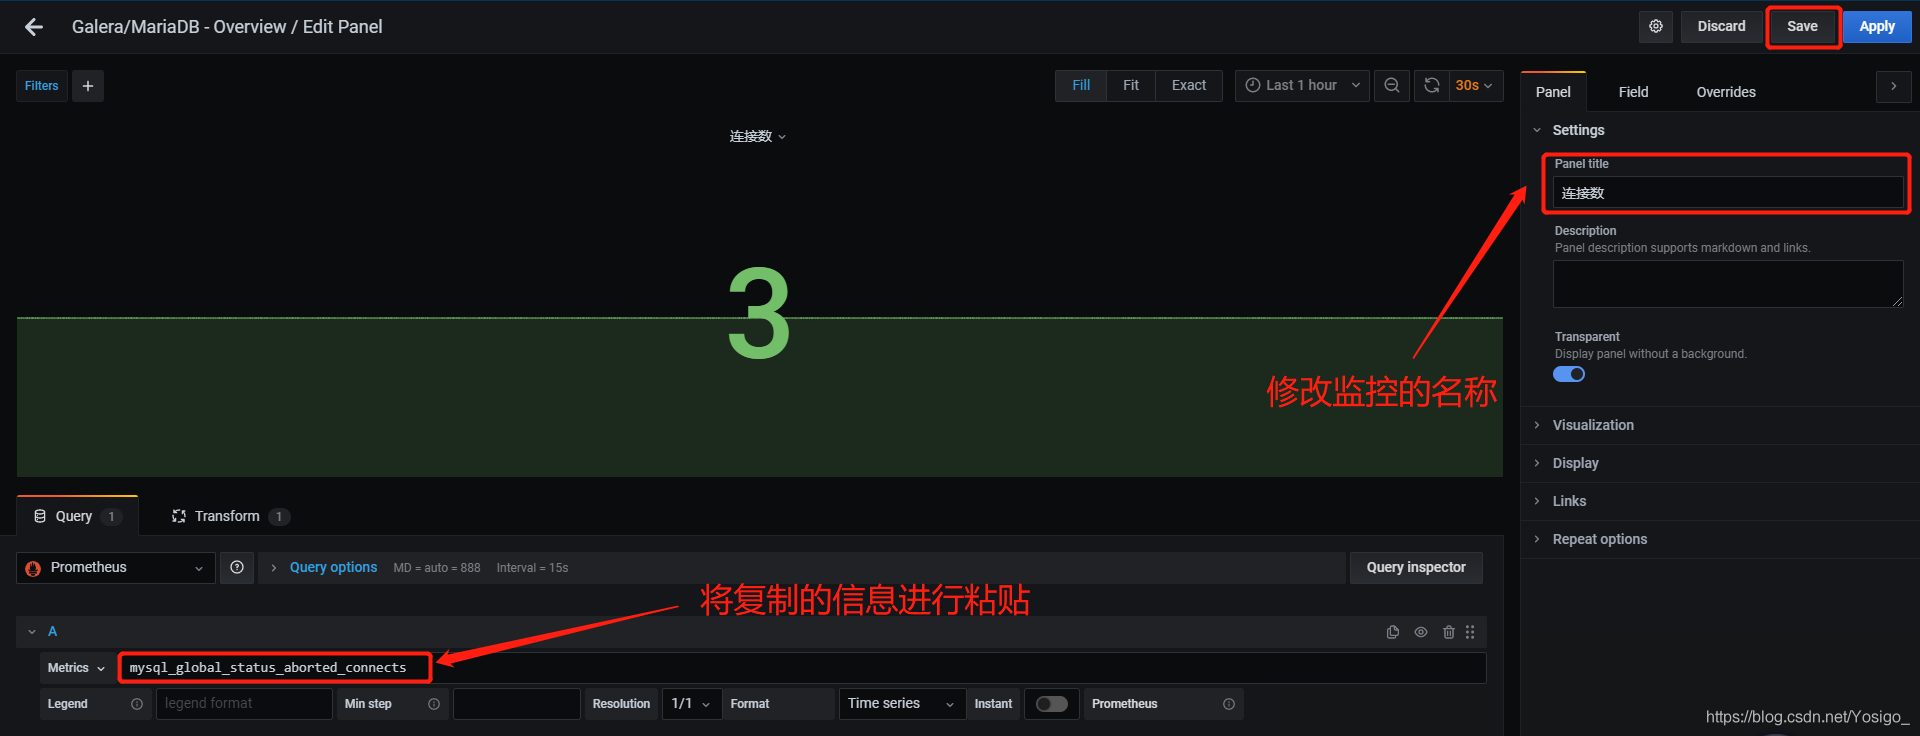
7.Mysql主机状态添加至Garafana展示
https://grafana.com/grafana/dashboards

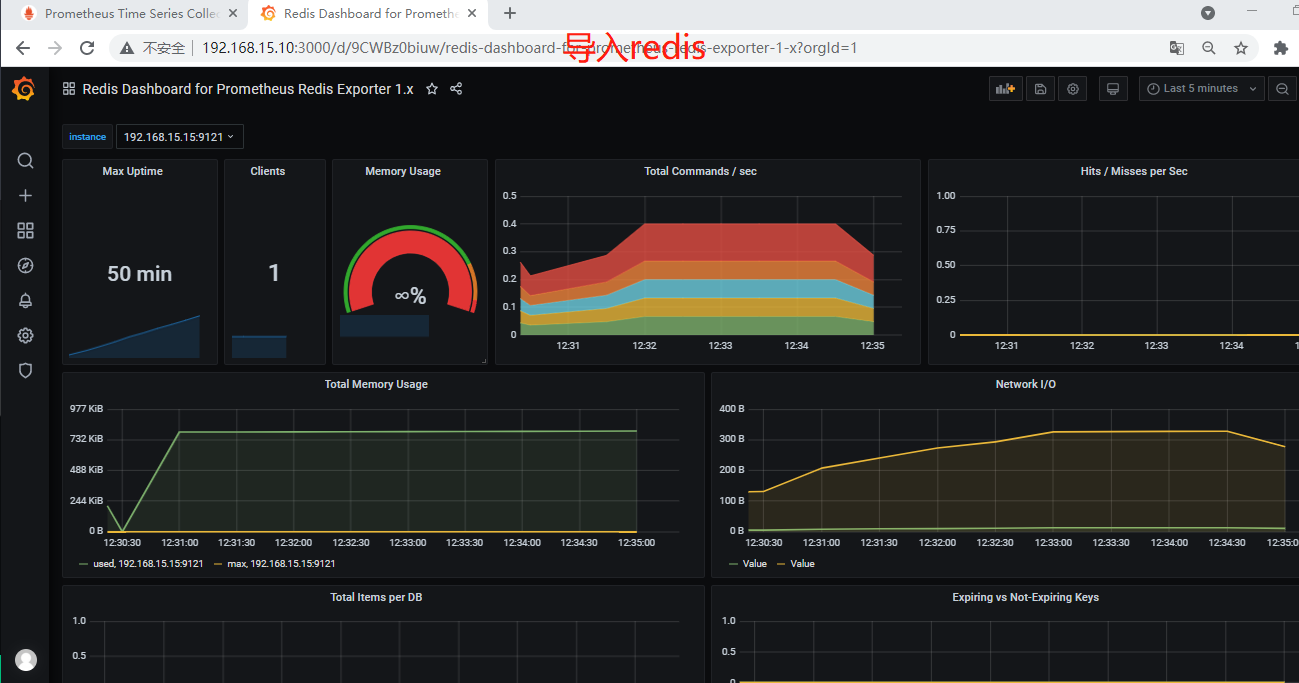
8.redis主机监控
[root@jenkins ~]# git clone https://github.com/oliver006/redis_exporter.git

[root@jenkins ~]# ll
drwxr-xr-x  7 root root      239 Aug 31 11:23 redis_exporter

[root@jenkins ~]# cd redis_exporter/
[root@jenkins redis_exporter]# ls
contrib  exporter  go.sum   main.go   README.md
docker   go.mod    LICENSE  Makefile  release-github-binaries.sh

[root@jenkins redis_exporter]# export GOPROXY=https://mirrors.aliyun.com/goproxy/   #golang阿里云代理添加至环境变量
[root@jenkins redis_exporter]# go build .      #编译

[root@jenkins redis_exporter]# ./redis_exporter --version
INFO[0000] Redis Metrics Exporter <<< filled in by build >>>    build date: <<< filled in by build >>>    sha1: <<< filled in by build >>>    Go: go1.15.14    GOOS: linux    GOARCH: amd64

[root@jenkins redis_exporter]# ./redis_exporter -redis.addr "redis://192.168.15.14:6379" #监控redis主机

[root@jenkins redis_exporter]# mv redis_exporter /usr/local/bin/

[root@jenkins redis_exporter]# cd /usr/lib/systemd/system
[root@jenkins system]# vim redis-exporter.service
[Unit]
Description=This is prometheus redis exporter
After=node_exporter.service

[Service]
Type=simple
ExecStart=/usr/local/bin/redis_exporter -redis.addr "redis://192.168.15.14:6379"
ExecReload=/bin/kill -HUP
KillMode=process
Restart=on-failure

[Install]
WantedBy=multi-user.target

[root@jenkins system]# systemctl daemon-reload
[root@jenkins system]# systemctl start redis-exporter.service

[root@jenkins system]# netstat -lnutp
... ...
tcp6       0      0 :::9121                 :::*                    LISTEN      40279/redis_exporte

#去prometheus主机上添加配置
[root@prometheus ~]# vim /usr/local/prometheus/prometheus.yml
- job_name: "RedisDB"
    static_configs:
      - targets:
        - "192.168.15.15:9121"

[root@prometheus ~]# systemctl restart prometheus
携带metircs接口的服务流程
  1.将外部服务,接入到集群中,需要用到EndPoints
  2.使用EndPoints关联Service
  3.使用Service注册一个ServiceMoniter
  4.ServiceMoniter自动注入到k8s集群之中
  5.从而实现容器化的Prometheus自动发现

  注意:监控ETCD需要证书,挂载到prometheus-k8s容器中
不携带metircs接口的服务流程
  1.在外部或者容器中,部署exporter,实现一个metircs接口服务
  2.将metircs接口服务,接入到集群中,需要用到EndPoints
  3.使用EndPoints关联Service
  4.使用Service注册一个ServiceMoniter
  5.ServiceMoniter自动注入到k8s集群之中
  6.从而实现容器化的Prometheus自动发现