ystrix除了隔离依赖服务的调用以外,Hystrix 还提供了准实时的调用监控(Hystrix Dashboard),Hystrix 会持续地记录所有通过 Hystrix 发起的请求的执行信息,并以统计报表和图形的形式展示给用户,包括每秒执行多少请求多少成功,多少失败等。
下面我们基于之前的示例来结合 Hystrix Dashboard 实现 Hystrix 指标数据的可视化面板,这里我们将用到下之前实现的几个应用,包括:
- eureka-server:服务注册中心
- service-producer:服务提供者
- service-hystrix-feign:使用 Feign 和 Hystrix 实现的服务消费者
创建 Hystrix Dashboard
创建一个标准的 Spring Boot 工程,命名为:service-hystrix-dashboard
POM依赖
1 <dependency>
2     <groupId>org.springframework.cloud</groupId>
3     <artifactId>spring-cloud-starter-netflix-hystrix</artifactId>
4 </dependency>
5 <dependency>
6     <groupId>org.springframework.cloud</groupId>
7     <artifactId>spring-cloud-starter-netflix-hystrix-dashboard</artifactId>
8 </dependency>
属性配置(application.yml)
spring:
  application:
    name: service-hystrix-dashboard
server:
  port: 11000
启动类
在 Spring Boot 的启动类上面引入注解@EnableHystrixDashboard,启用 Hystrix Dashboard 功能
 1 package com.carry.springcloud;
 2
 3 import org.springframework.boot.SpringApplication;
 4 import org.springframework.boot.autoconfigure.SpringBootApplication;
 5 import org.springframework.cloud.netflix.hystrix.dashboard.EnableHystrixDashboard;
 6
 7 @EnableHystrixDashboard
 8 @SpringBootApplication
 9 public class ServiceHystrixDashboardApplication {
10
11     public static void main(String[] args) {
12         SpringApplication.run(ServiceHystrixDashboardApplication.class, args);
13     }
14 }
启动应用,然后再浏览器中输入 http://localhost:11000/hystrix 可以看到如下界面
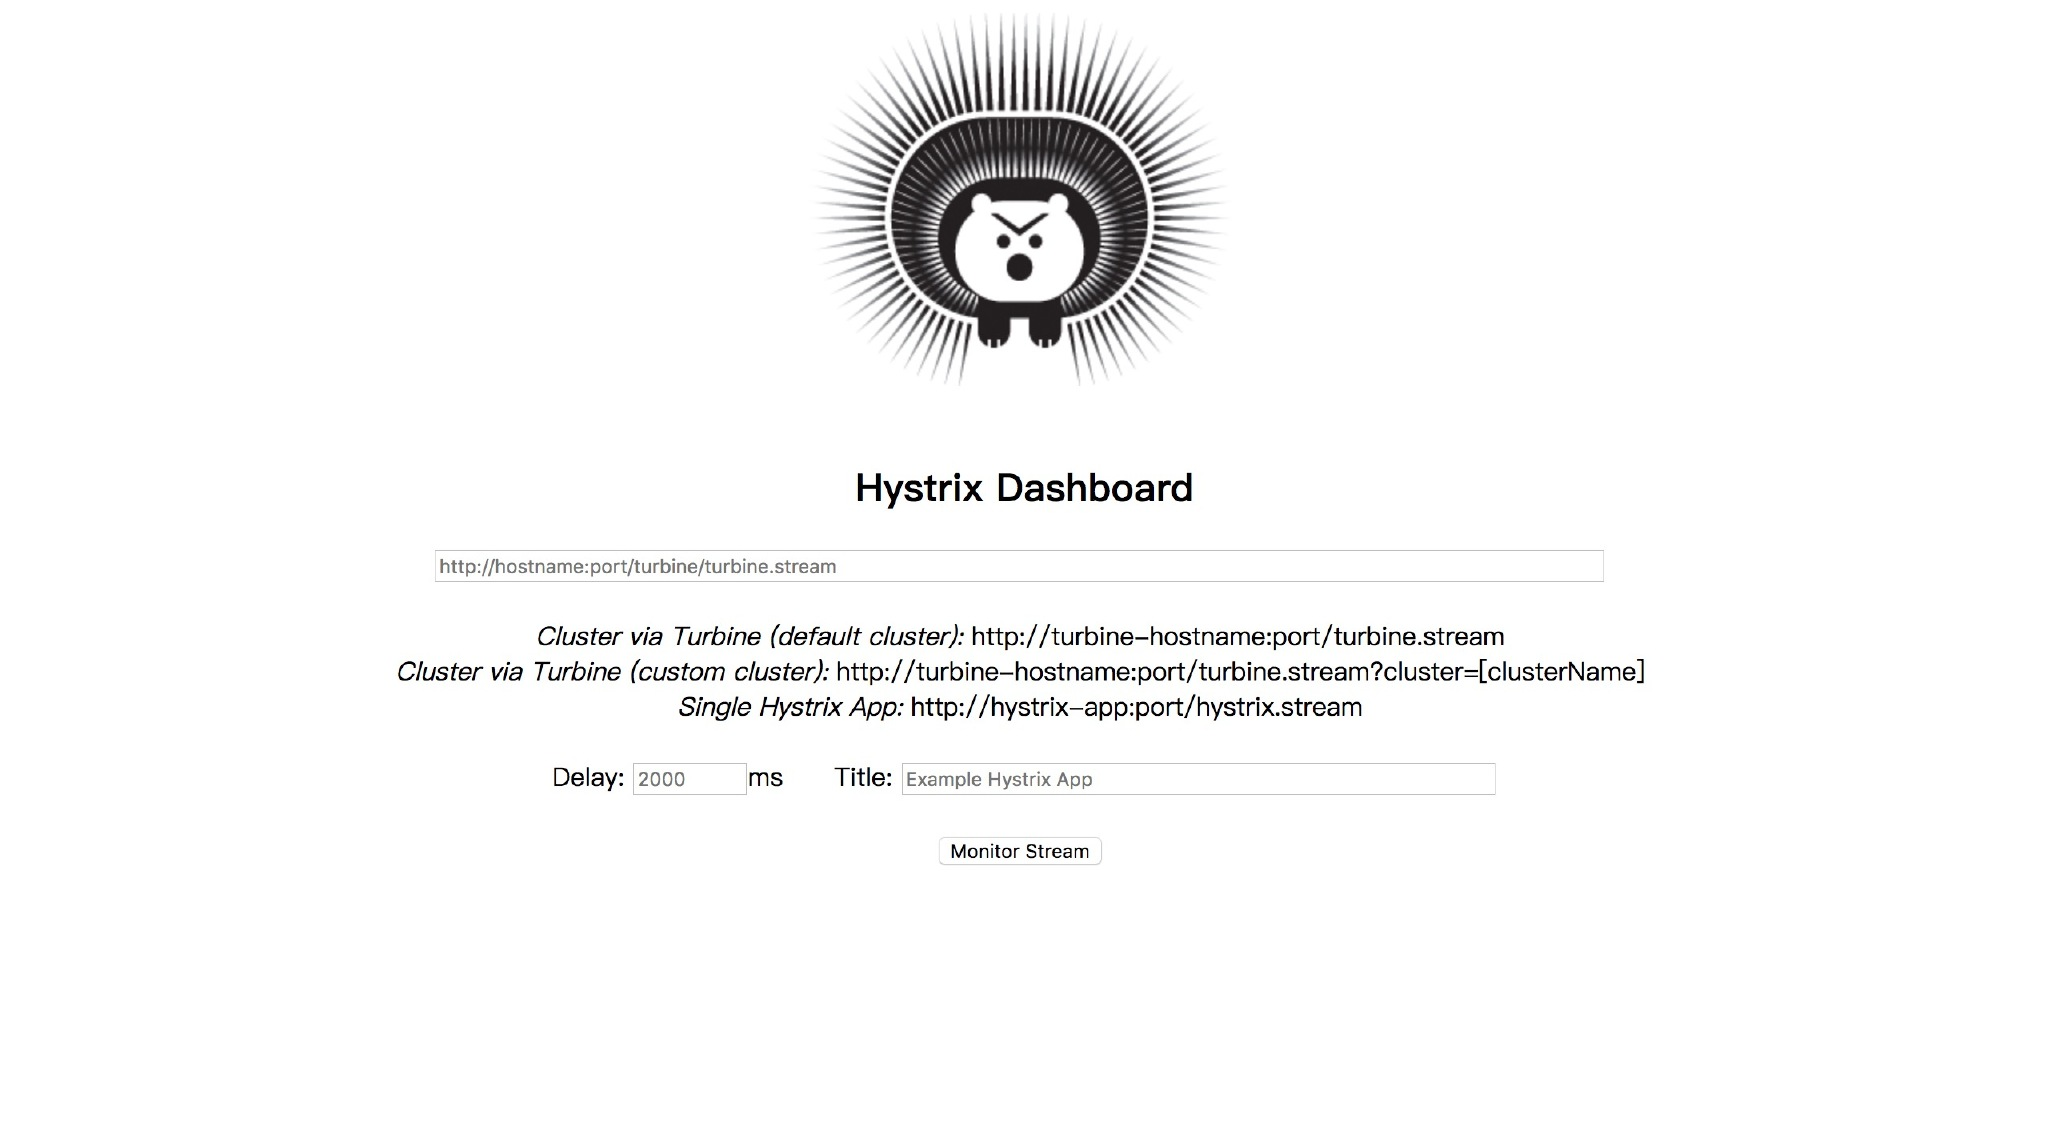
通过 Hystrix Dashboard 主页面的文字介绍,我们可以知道,Hystrix Dashboard 共支持三种不同的监控方式:
- 默认的集群监控:通过 URL:http://turbine-hostname:port/turbine.stream 开启,实现对默认集群的监控。
- 指定的集群监控:通过 URL:http://turbine-hostname:port/turbine.stream?cluster=[clusterName] 开启,实现对 clusterName 集群的监控。
- 单体应用的监控: 通过 URL:http://hystrix-app:port/actuator/hystrix.stream 开启,实现对具体某个服务实例的监控。(可通过
management.endpoints.web.base-path修改)
前两者都对集群的监控,需要整合 Turbine 才能实现。这一部分我们先实现对单体应用的监控,这里的单体应用就用我们之前使用 Feign 和 Hystrix 实现的服务消费者——service-hystrix-feign。
页面上的另外两个参数:
- Delay:控制服务器上轮询监控信息的延迟时间,默认为 2000 毫秒,可以通过配置该属性来降低客户端的网络和 CPU 消耗。
- Title:该参数可以展示合适的标题。
为服务实例service-hystrix-feign添加 endpoint
Hystrix Dashboard 监控单实例节点需要通过访问实例的/actuator/hystrix.stream接口来实现,所以我们需要为服务实例添加这个 endpoint
POM依赖
在服务实例pom.xml中的dependencies节点中新增spring-boot-starter-actuator监控模块以开启监控相关的端点,并确保已经引入断路器的依赖spring-cloud-starter-netflix-hystrix
1 <dependency>
2     <groupId>org.springframework.boot</groupId>
3     <artifactId>spring-boot-starter-actuator</artifactId>
4 </dependency>
启动类
为启动类添加@EnableCircuitBreaker或@EnableHystrix注解,开启断路器功能
 1 package com.carry.springcloud;
 2
 3 import org.springframework.boot.SpringApplication;
 4 import org.springframework.boot.autoconfigure.SpringBootApplication;
 5 import org.springframework.cloud.netflix.hystrix.EnableHystrix;
 6 import org.springframework.cloud.openfeign.EnableFeignClients;
 7
 8 @EnableHystrix
 9 @EnableFeignClients
10 @SpringBootApplication
11 public class ServiceHystrixFeignApplication {
12
13     public static void main(String[] args) {
14         SpringApplication.run(ServiceHystrixFeignApplication.class, args);
15     }
16 }
配置文件
在配置文件 application.yml 中添加
management:
  endpoints:
    web:
      exposure:
        include: hystrix.stream
management.endpoints.web.exposure.include这个是用来暴露 endpoints 的,由于 endpoints 中会包含很多敏感信息,除了 health 和 info 两个支持 web 访问外,其他的默认不支持 web 访问。详情请看官方文档 50. Endpoints
测试
在Hystrix-Dashboard 的主界面上输入service-hystrix-feign对应的地址 http://localhost:9002/actuator/hystrix.stream 然后点击 Monitor Stream 按钮,进入页面如果没有请求会一直显示 “Loading…”,这时访问 http://localhost:9002/actuator/hystrix.stream 也是不断的显示“ping”,然后访问一下 http://localhost:9002/getPoducerInfoByFeign,可以看到 Hystrix Dashboard 中出现了类似下面的效果
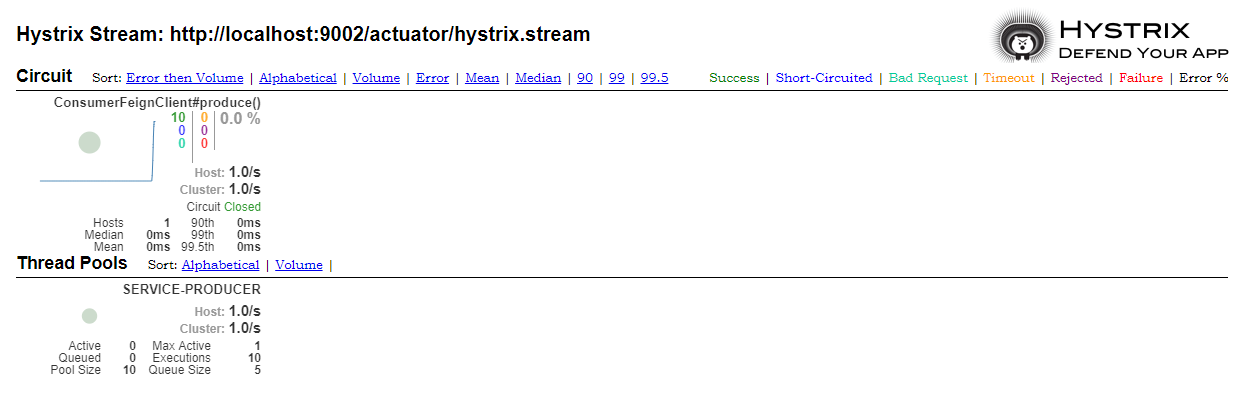
提示:如果在这个页面看到报错:Unable to connect to Command Metric Stream.,可以参考这个 Issue 解决
停掉服务生产者service-producer,继续多次访问http://localhost:9002/getPoducerInfoByFeign,最终发现Circuit的值变成Open,此时说明断路器已经打开

界面解读
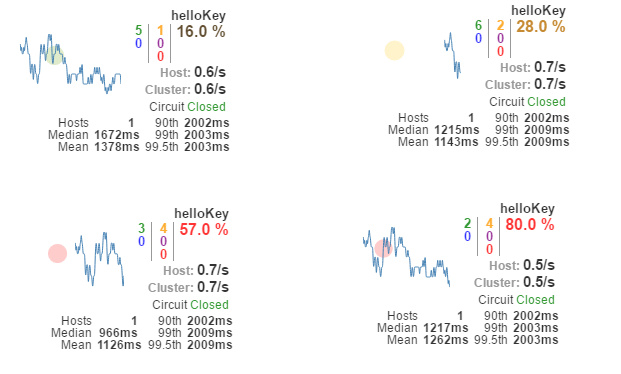
以上图来说明其中各元素的具体含义:
- 实心圆:它有颜色和大小之分,分别代表实例的监控程度和流量大小。如上图所示,它的健康度从绿色、黄色、橙色、红色递减。通过该实心圆的展示,我们就可以在大量的实例中快速的发现故障实例和高压力实例。
- 曲线:用来记录 2 分钟内流量的相对变化,我们可以通过它来观察到流量的上升和下降趋势。
- 其他一些数量指标如下图所示
