ECharts之类型bar
原博客主链接:http://www.cnblogs.com/carsonwuu/p/8267457.html
效果:
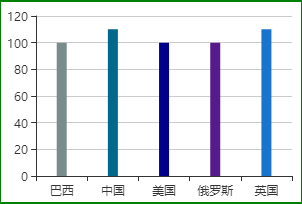
可运行代码:
 1 <!DOCTYPE html>
 2 <html>
 3 <head>
 4 <meta charset="utf-8">
 5 <title>条形图</title>
 6 <!-- 引入 echarts.js -->
 7 <script src="https://cdn.bootcss.com/echarts/3.8.5/echarts.min.js"></script>
 8 </head>
 9 <body>
10 <!-- 为ECharts准备一个具备大小(宽高)的Dom -->
11
12 <div id="main" style="500px;height:200px;border: 2px solid green;"></div>
13
14 <script type="text/javascript">
15 // 基于准备好的dom,初始化echarts实例
16
17 function Bar(dataArray,divname,colorL){
18     var name=dataArray.map(function(data){
19         return data.name;
20     }),
21         data=dataArray.map(function(data){
22         return data.value;
23     });
24     var myChart = echarts.init(document.getElementById(divname));
25     option = {
26
27     tooltip: {
28          formatter: '{b} ({c})'
29     },
30     legend: {
31         data:''
32     },
33     grid: {
34         left: '2%',
35         right: '4%',
36         bottom: '3%',
37         '95%',
38         height:'90%',
39
40         containLabel: true
41     },
42     xAxis: {
43          type: 'category',
44         data: name
45
46     },
47     yAxis: {
48        type: 'value',
49         boundaryGap: [0, 0.01]
50     },
51     series: [
52         {
53             name: name,
54             type: 'bar',
55             barWidth : 10,
56             data: data,
57             label:{normal:{show:true, position:"top",textStyle:{color:"#9EA7C4"}}},
58              itemStyle : {
59                 normal : {
60                     //柱状图颜色
61                     color : function(params) {
62                         // 颜色列表
63                         var colorList = colorL;
64                         //返回颜色
65                         return colorList[params.dataIndex];
66                     },
67
68                 }
69             }
70         }
71     ]
72 };
73
74
75 // 使用刚指定的配置项和数据显示图表。
76 myChart.setOption(option);
77 };
78
79
80 var arr=[{name:'巴西',value:100},{name:'中国',value:110},{name:'美国',value:100},{name:'俄罗斯',value:100},{name:'英国',value:110}];
81 var color=[ 'rgb(122 ,139 ,139)','rgb(0, 104, 139)','rgb(0, 0, 139)','rgb(85, 26, 139)','rgb(24 ,116 ,205)','rgb(0 ,0 ,255)','rgb(70 ,130 ,180)','rgb(0 ,139 ,139)','rgb(0, 255, 255)','rgb(78 ,238 ,148)','rgb(0 ,191 ,255)','rgb(46 ,139 ,87)' ];
82 Bar(arr,'main',color);
83
84
85
86 </script>
87 </body>
88 </html>