| 这个作业属于哪个课程 | 2020春|S班 |
|---|---|
| 这个作业要求在哪里 | 作业要求 |
| 结对学号 | 221701308、221600313 |
| 这个作业的目标 | 实现疫情统计可视化 |
| 作业正文 | 作业正文 |
| 其他参考文献 | CSDN,博客园,百度,知乎 |
仓库链接和代码规范
https://github.com/jieduizuoye2/InfectStatisticWeb/tree/dev
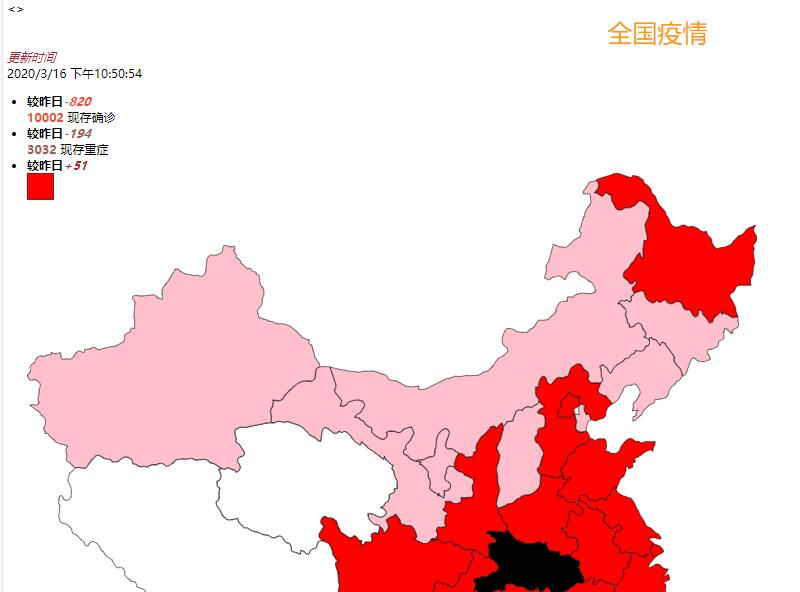
成品展示
结对过程


设计实现过程
功能结构图:
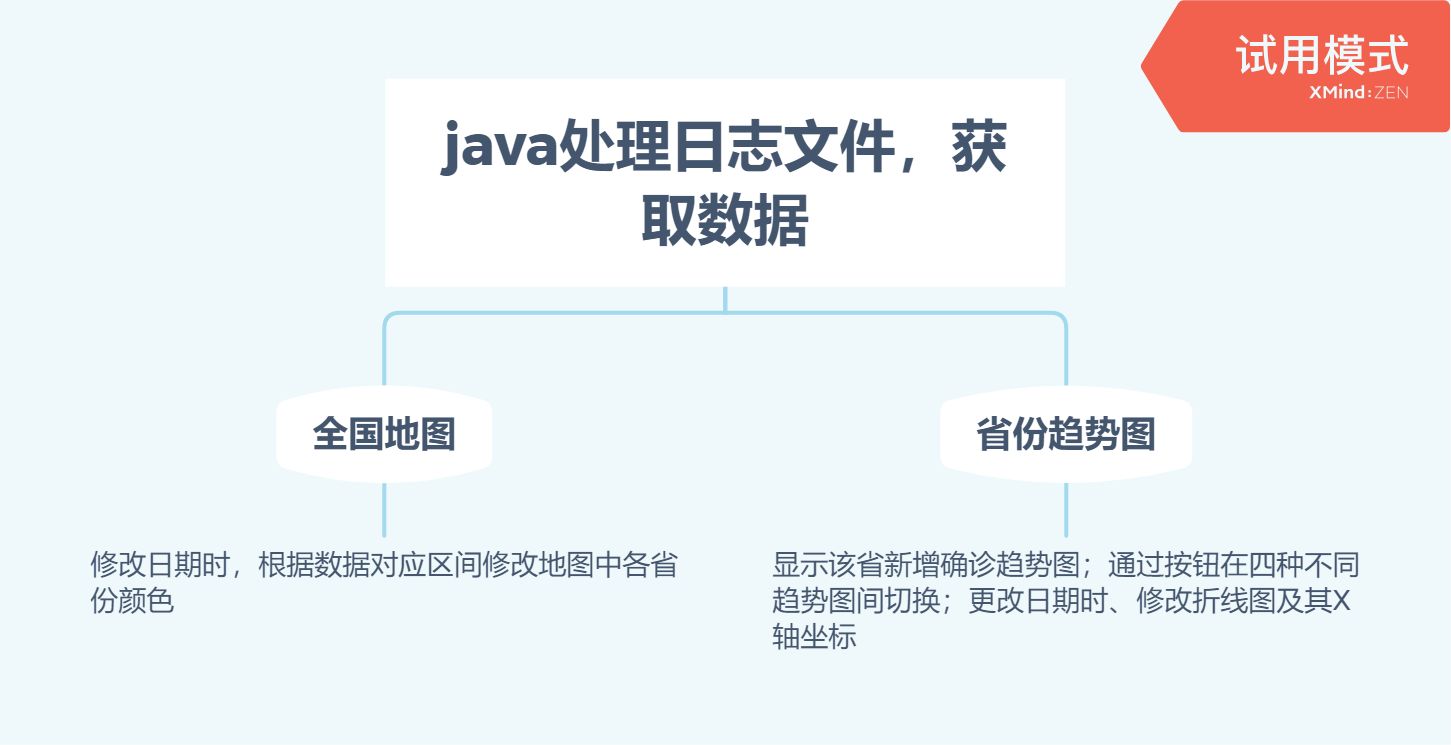
将实现内容拆分为图片相关(全国地图鼠标移动高亮、单击跳转;折线图;日期变化时根据数据修改图片)和其余部分,分工合作;
svg图片自身即有一部分交互性,所以选择使用svg图片制作;
单击跳转通过添加链接即可实现,高亮通过改变填充色即可;通过改变属性“points”即可改变已有折线图;
通过循环遍历所选日期及其前n天数据,计算x、y值,添加到字符串中,最后作为setAttribute的参数之一,修改属性“points”;
中途发现折线图的X轴坐标(对应日期),在日期改变时需要一并修改,本来想直接修改text标签的显示,但经过尝试未找到可用方法,所以转而尝试将它隐藏(填充改为白色),然后添加新的text
关键代码
在svg图像中,各省部分添加链接,实现单击跳转;直接使用svg交互事件完成鼠标移动区域高亮显示
        <a xlink:href="Tianjin.html">
        <path id="Tianjin" fill="pink" stroke="black" stroke-width="1" d="M 1034.53 440.88 C 1034.45 445.55 1035.14 448.38 1035.73 452.77 C
        1034.15 452.59 1029.68 451.32 1028.54 452.77 C 1026.44 455.17 1030.54 462.59 1030.75 465.48 C 1030.75 465.48 1029.23 476.29 1029.23
        476.29 C 1029.14 477.52 1029.15 478.73 1029.74 479.86 C 1030.82 481.91 1035.83 485.05 1038.13 485.33 C 1039.84 485.53 1046.75 483.9
        1048.98 483.49 C 1048.98 483.49 1048.98 477.49 1048.98 477.49 C 1049.42 474.28 1051.86 466.02 1054.45 464.13 C 1055.62 463.27 1056.56
        463.24 1057.93 463.08 C 1057.93 463.08 1053.73 451.68 1053.73 451.68 C 1053.73 451.68 1048.93 452.88 1048.93 452.88 C 1048.93 452.88
        1045.61 446.88 1045.61 446.88 C 1045.61 446.88 1044.13 439.68 1044.13 439.68 C 1044.13 439.68 1048.33 438.48 1048.33 438.48 C 1044.75
        434.42 1037.63 430.46 1034.89 437.88 C 1034.54 438.82 1034.55 439.9 1034.53 440.88 C 1034.53 440.88 1034.53 440.88 1034.53 440.88 Z"
        >
        <set attributeName="fill" from="pink" to="yellow" begin="mouseover" end="mouseout"/>
        </path>
        </a>
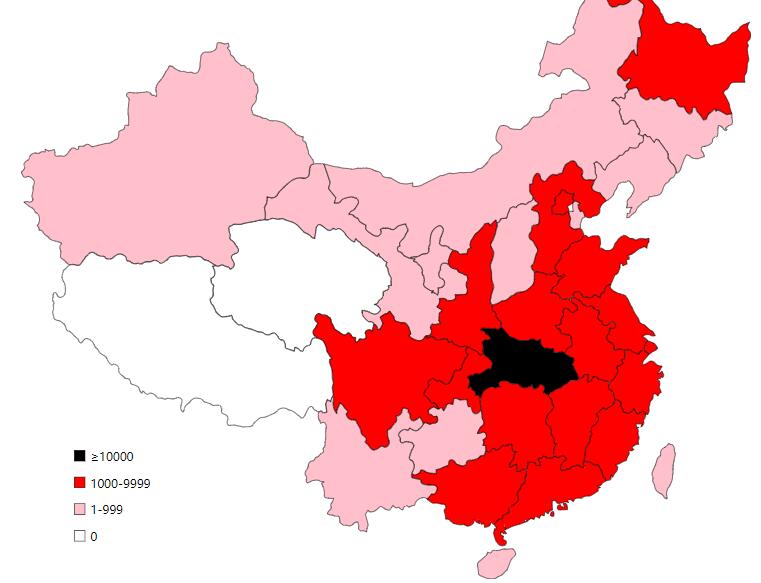
日期改变时,依次确认各省确诊人数区间,更改填充色
        for(var i=0;i<city.length;i++){//根据当前确诊人数调整地图颜色
            var nowchange = document.getElementById(city[i]);
            if( date[i] >= 10000 ){
                nowchange.setAttribute("fill","black");
            }
            else if( date[i] >= 1000 ){
                nowchange.setAttribute("fill","red");
            }
            else if( date[i] >= 1 ){
                nowchange.setAttribute("fill","pink");
            }
            else{
                nowchange.setAttribute("fill","white");
            }
        }
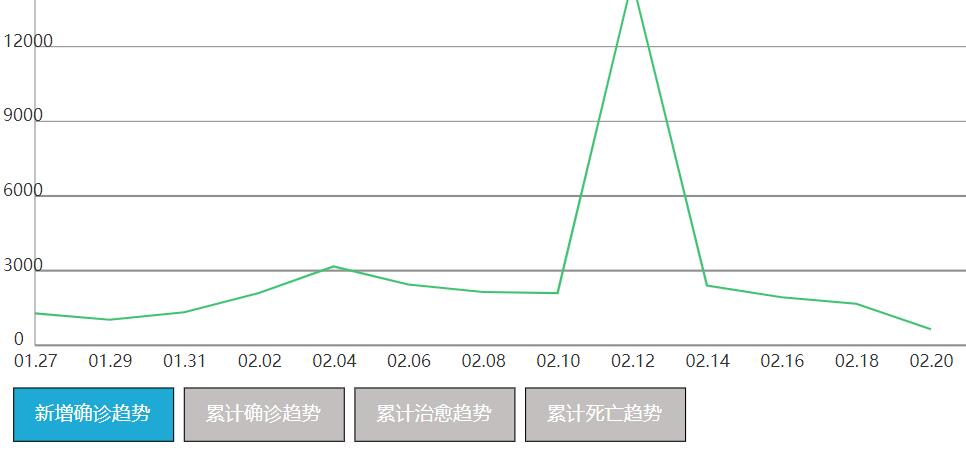
选择新增确诊趋势/累计确诊趋势/累计治愈趋势/累计死亡趋势时,已选择对象对应按钮填充亮色提示,其余按钮填充灰色
        var rect0 = document.getElementById('rect0');
        var rect1 = document.getElementById('rect1');
        var rect2 = document.getElementById('rect2');
        var rect3 = document.getElementById('rect3');
        rect0.addEventListener('click', function(e) {
            console.log('rect0 clicked - enlarging');
            rect0.setAttribute("fill","rgb(30, 170, 212)");
            rect1.setAttribute("fill","rgb(196, 191, 191)");
            rect2.setAttribute("fill","rgb(196, 191, 191)");
            rect3.setAttribute("fill","rgb(196, 191, 191)");
            CreatPolyLine(nDate,0);
        }, false);
        rect1.addEventListener('click', function(e) {
            console.log('rect1 clicked - enlarging');
            rect1.setAttribute("fill","rgb(30, 170, 212)");
            rect0.setAttribute("fill","rgb(196, 191, 191)");
            rect2.setAttribute("fill","rgb(196, 191, 191)");
            rect3.setAttribute("fill","rgb(196, 191, 191)");
            CreatPolyLine(nDate,1);
        }, false);
        rect2.addEventListener('click', function(e) {
            console.log('rect2 clicked - enlarging');
            rect2.setAttribute("fill","rgb(30, 170, 212)");
            rect1.setAttribute("fill","rgb(196, 191, 191)");
            rect0.setAttribute("fill","rgb(196, 191, 191)");
            rect3.setAttribute("fill","rgb(196, 191, 191)");
            CreatPolyLine(nDate,2);
        }, false);
        rect3.addEventListener('click', function(e) {
            console.log('rect3 clicked - enlarging');
            rect3.setAttribute("fill","rgb(30, 170, 212)");
            rect1.setAttribute("fill","rgb(196, 191, 191)");
            rect2.setAttribute("fill","rgb(196, 191, 191)");
            rect0.setAttribute("fill","rgb(196, 191, 191)");
            CreatPolyLine(nDate,3);
        }, false);
字符串存储计算结果,以结果作为“points”属性值,修改原有折线图;使原有坐标刻度填充白色(不可见),添加新刻度,实现X轴日期标识的更新
        //生成趋势折线图,参数nDate为当前所选日期在date数组中所在位置
        //style:0-新增确诊趋势,1-累计确诊趋势,2-治愈趋势,3-死亡趋势
        function CreatPolyLine(nDate,style){
            polyline="";
            var i = ( ( nDate >= date.length ) ? ( nDate - point ) : 0 );
            var poly = document.getElementById('poly');
            var j;
            for( j = 0 ; i <= nDate ; i ++ ,j ++ ){
                var x = 30 + 70 * j ;
                var y = 380 - ( date[nDate][style] * ( 70 / 3000 ) );
                polyline += x + "," + y ;
                if ( ( i + 1 ) <= nDate ){
                    polyline += " ";
                }
            }
            poly.setAttribute("points",polyline);

            //隐藏原有X轴坐标
            var oldText =document.getElementsByTagName("text");
            for( j =0 ; j < oldText.length ; j ++){
                if(oldText[j].getAttribute("y") == 400){
                    oldText[j].setAttribute("fill","white");
                }
            }

            //建立新X轴坐标
            i = ( ( nDate >= date.length ) ? ( nDate - point ) : 0 );
            for( j = 0 ; i <= nDate ; j ++ , i ++ ){
                var svg =document.getElementById('mysvg');
                var sdate ="";
                var x = "" ;
                x = 10 + j * 70 ;
                sdate += howManyDate [i];
                var newText = document.createElementNS("http://www.w3.org/2000/svg", "text");
                newText.setAttribute("x", x);
                newText.setAttribute("y", "400");
                newText.setAttribute("fill", "#333");
                newText.appendChild(document.createTextNode(sdate));
                svg.appendChild(newText);
            }
        }
心路历程与收获
本次实现中涉及了不少过去几年大学生活中没有接触过的部分,在尝试自学的过程中,绕了不少弯路,只能先搜索需要的功能实现方法,然后慢慢摸索,让我深刻意识到了通过课堂、参考书等获取知识相较自学的便利性。
通过与同伴合作,可以回避自身不拿手的部分,且在面对众多不熟悉知识时,减少了个人在短时间内需要探索、掌握的知识量。
对合作同伴的评价:给我提供了很多帮助,感谢他在作业完成过程中的努力。