Azure Monitor是Azure上提供的通过监控一系列数据来监测应用程序的可用性和性能的解决方案,监测的数据包括Metrics,Logs,监测的平台可以是一个Azure的订阅,资源组,也可以是这些资源组下面具体的VM,应用程序,甚至包括本地或者其他平台上的Guest OS/应用都可以支持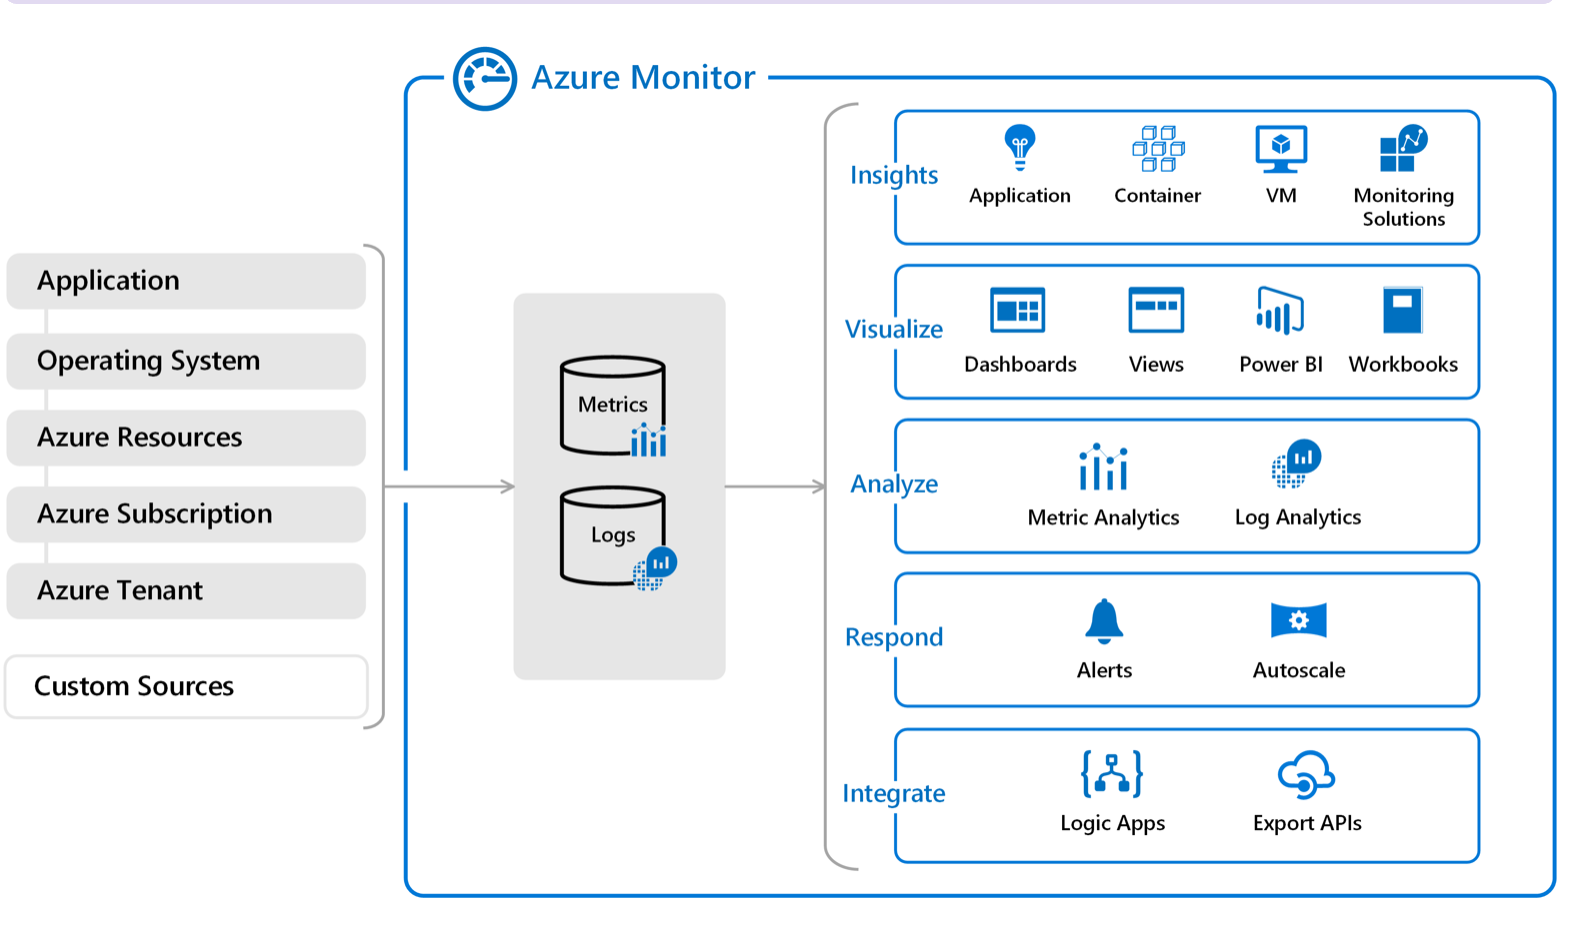
在应用方面,Azure Monitor有Application Insights 和 Azure Monitor for containers两项服务为应用程序提供更深层次的监控和分析,Application Insights 提供Application Map,Live Metrics Stream,Availability,Failures & Performance等十个细化的功能,利用这个工具既可以监测到应用本身的健康状况,也可以在业务层面更好的了解用户访问的相关信息,关于这十个功能模块的介绍,可以参考我同事赵健写的一篇博客:借助Application Insights,让Apps快速拥有APM,目前Application Insights官方支持 .Net / Java / Node.js几种语言,社区支持Python,PHP等其他语言,下面这篇文章会演示如何用Application Insights监视一个Python(Django框架)的应用。因为篇幅较长,我们把它大体分成两篇,第一篇验证Application Insights监控本地应用,第二篇用Application Insights监控一个部署在VM中的应用,除了看应用本身之外,我们还会看一下Azure Monitor在平台级别的监控如何。下面先开始准备工作:
(1)在用Azure VM + Azure Database for MySQL搭建Web服务这篇文章中,我们已经在Azure China Cloud搭好了一个WEB应用,为准备好环境,我们可以用快照跨区域复制的方法把这个VM快照拷贝到Global Auzre账号下,
这里遇到一个“小坑”,我们还用这篇文章用到的命令(Azure上几种常见的VM复制操作)来将快照跨区域复制到美东,
az storage blob copy start --destination-blob <name> --destination-container <name> --account-name <name> -account-key <> --source-uri <>
发现会报错:
You do not have the required permissions needed to perform this operation. Depending on your operation, you may need to be assigned one of the following roles:
'Storage Blob Data Contributor (Preview)'
'Storage Blob Data Reader (Preview)'
'Storage Queue Data Contributor (Preview)'
'Storage Queue Data Reader (Preview)'
如果提示是这样,表明你没有权限,这时候需要给自己添加列出来的一个角色(即使你是这个存储账号的owner也需要添加),参照https://docs.microsoft.com/zh-cn/azure/storage/common/storage-auth-aad-rbac-portal 操作之后再运行就可以了: 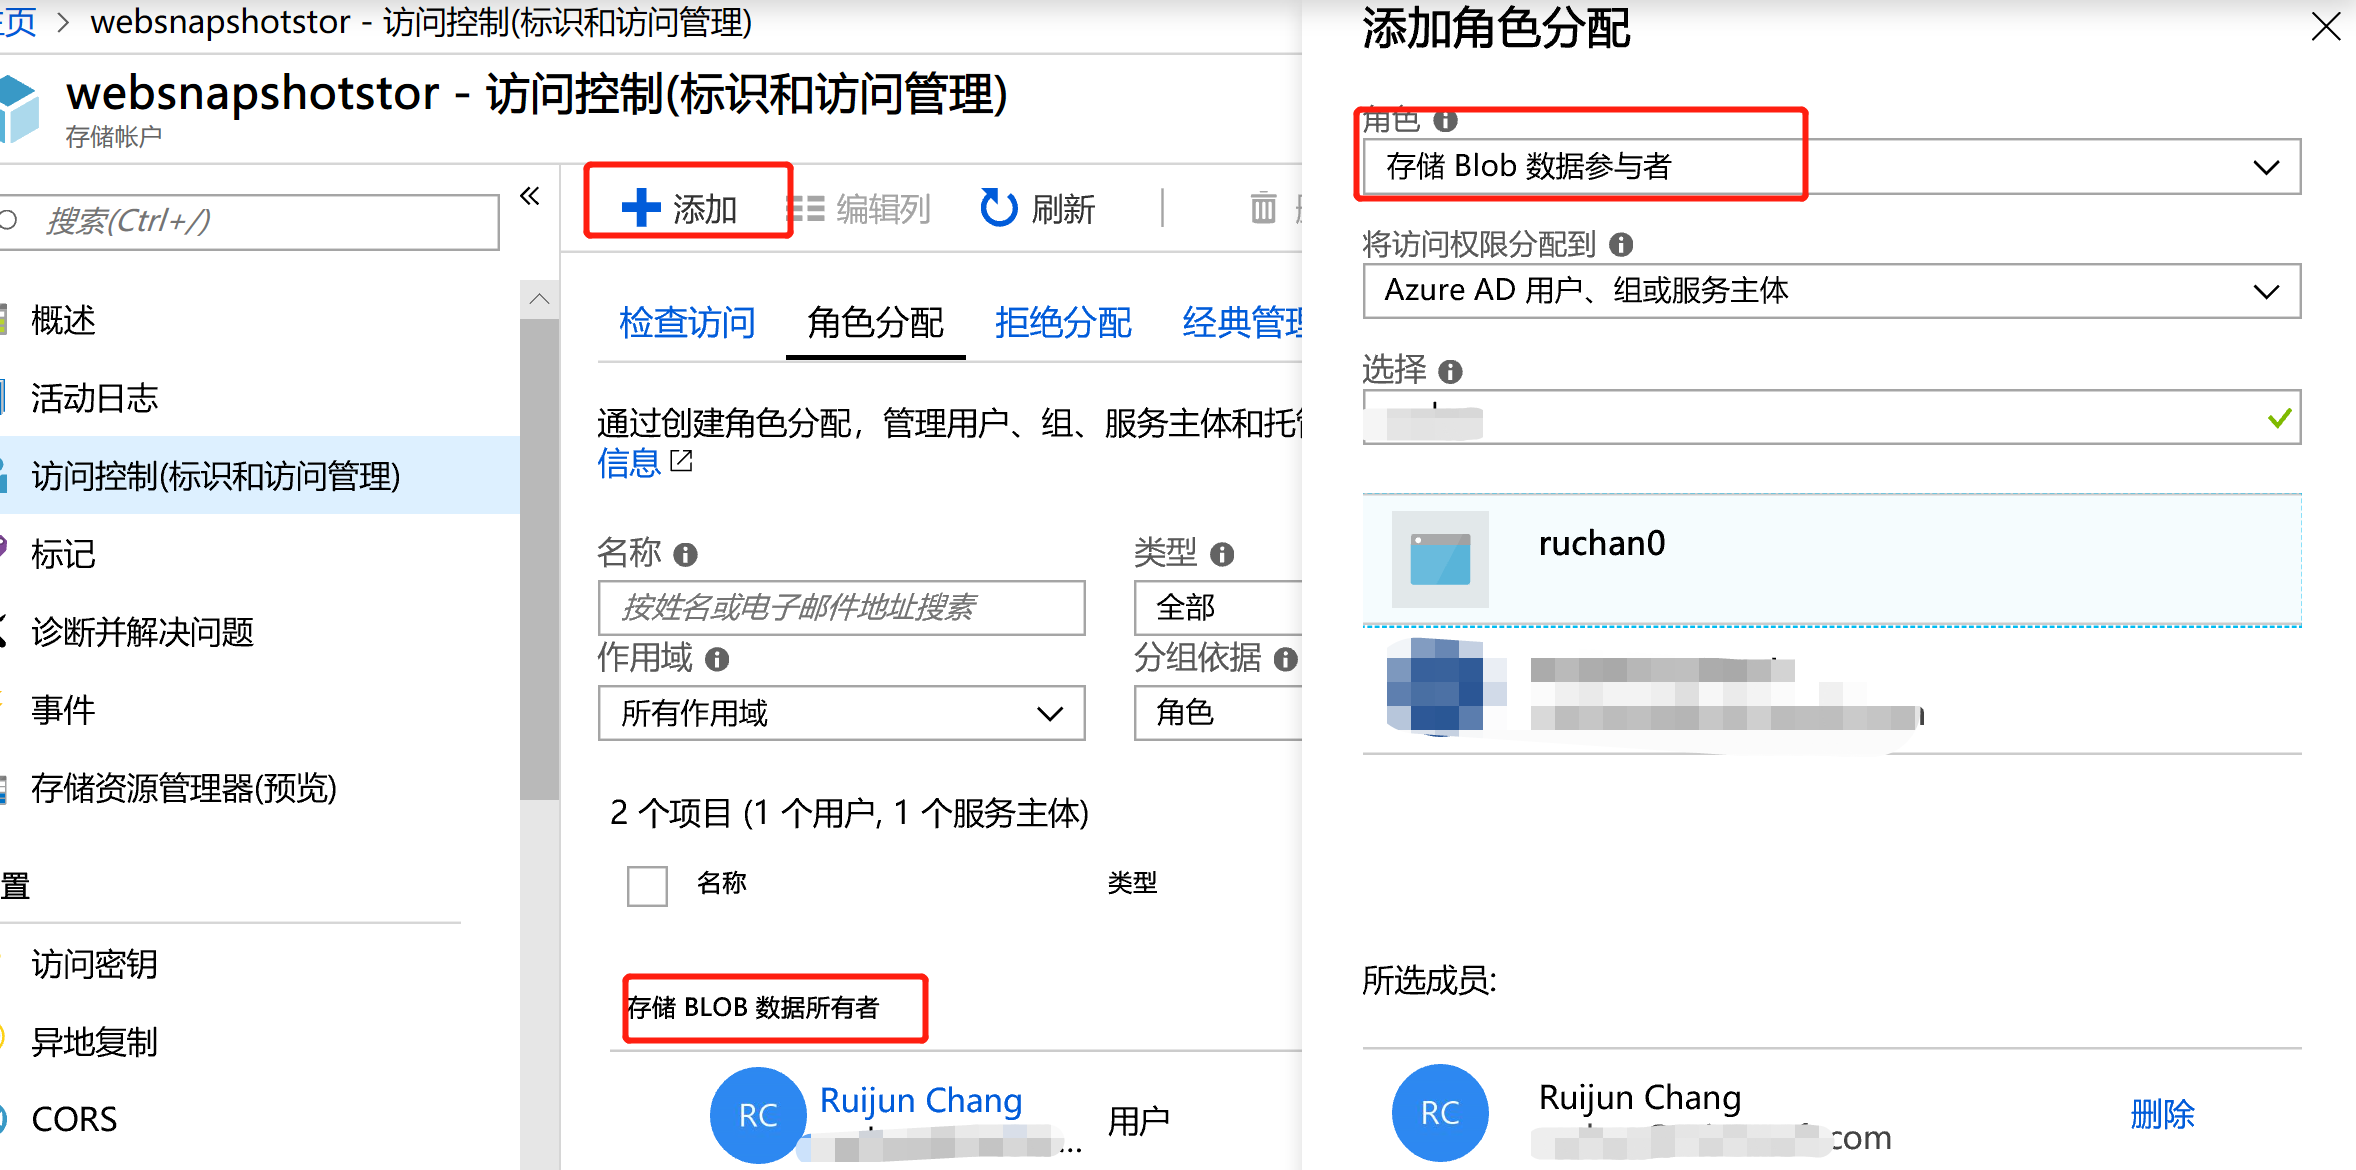
快照复制完之后我们创建好虚拟机,重新调试一下环境没问题。
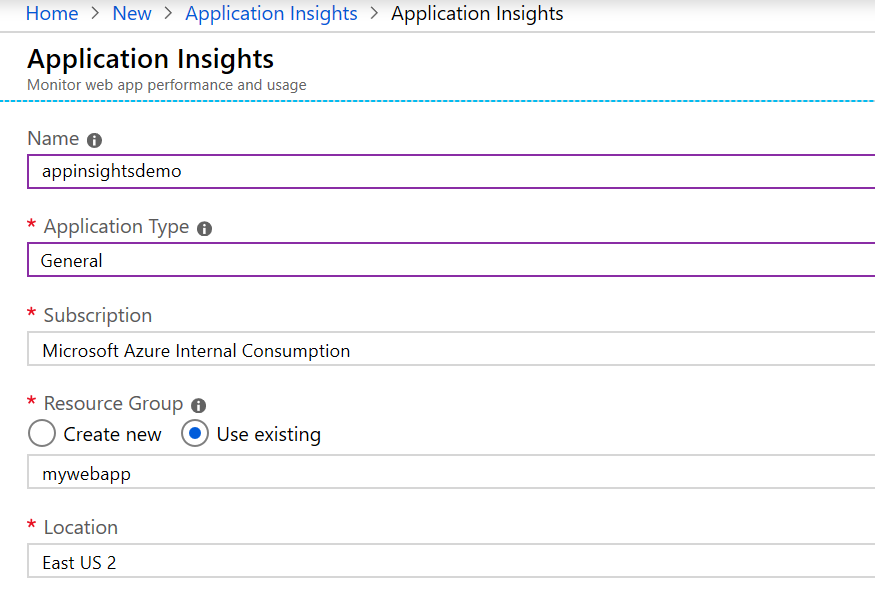
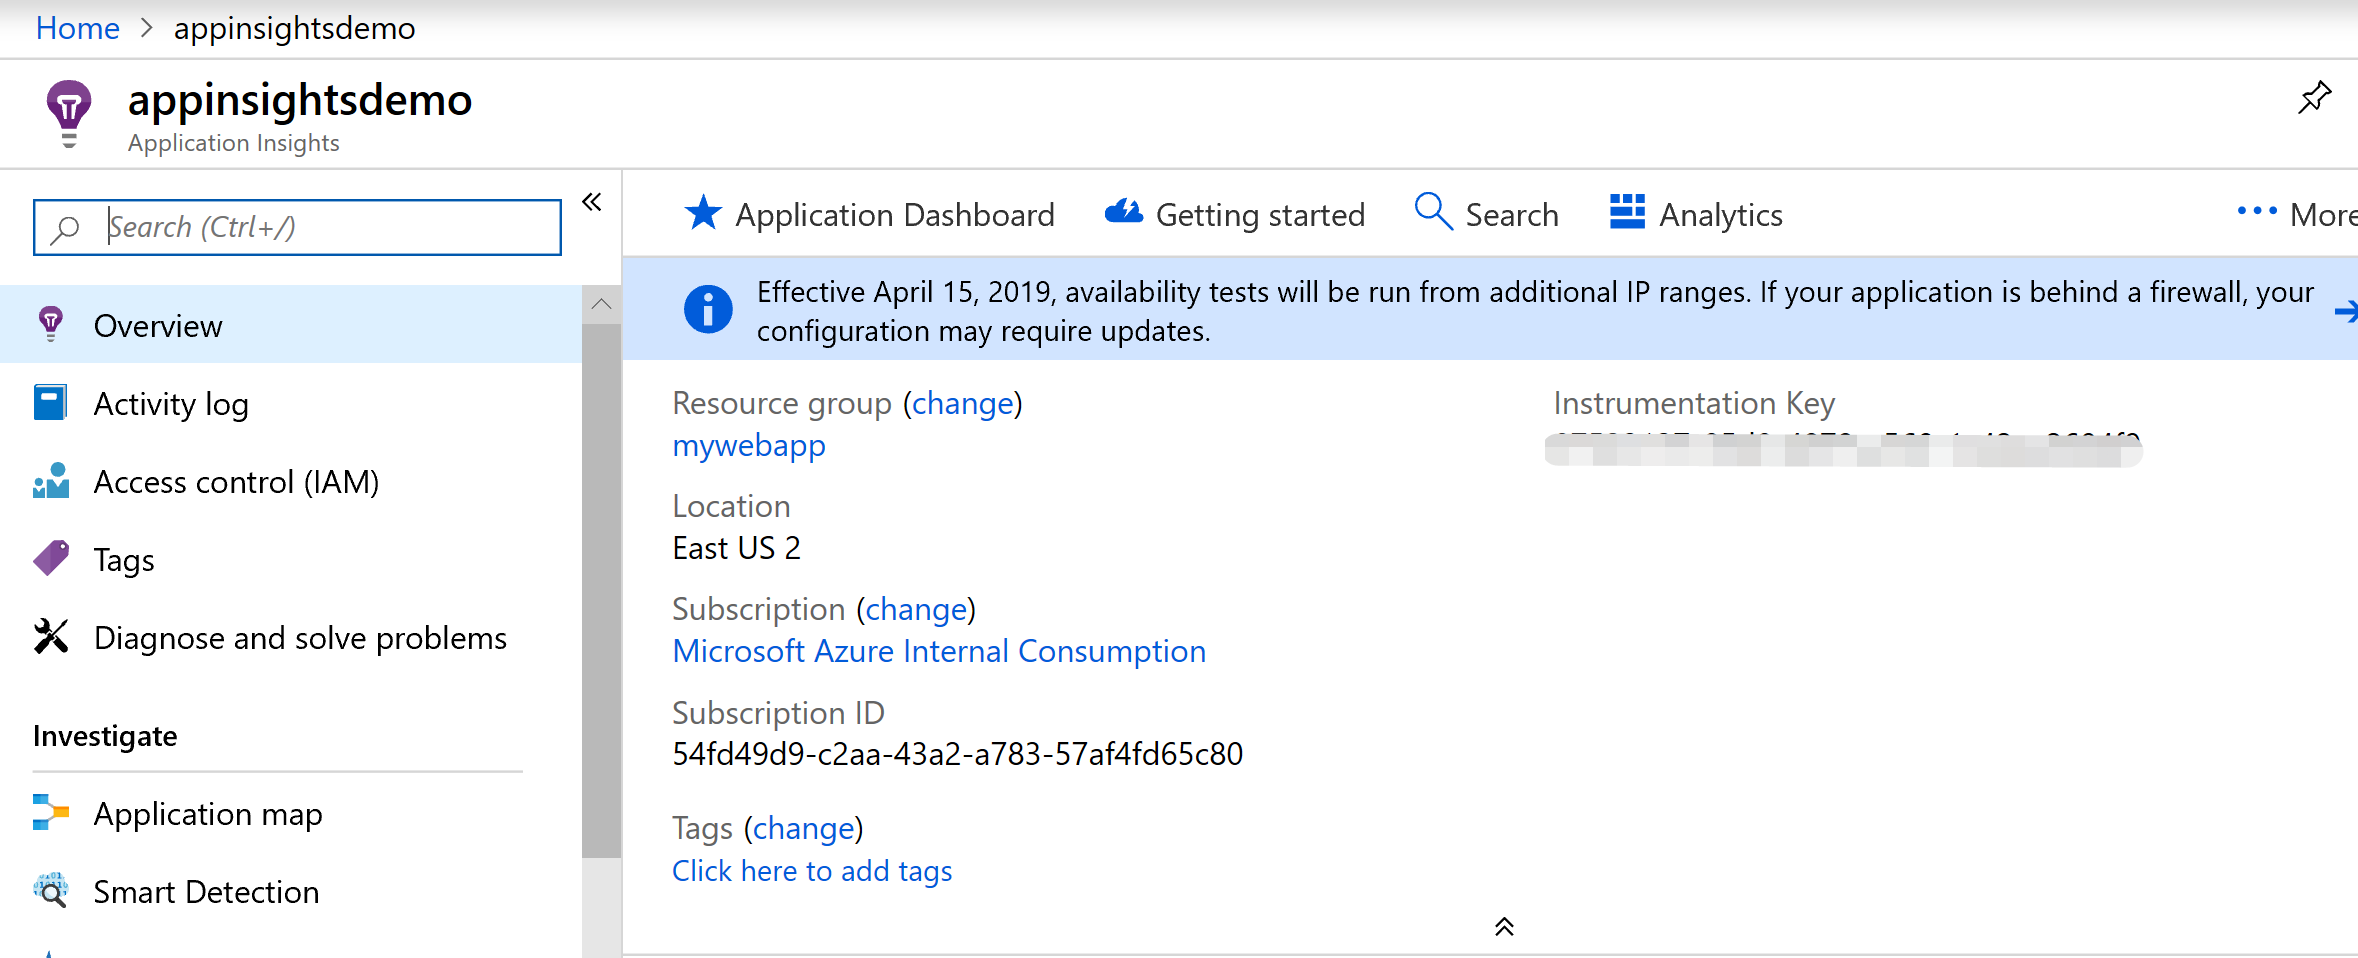
(2)创建一个application insights服务,在portal.azure.com的market place 搜索application insights,创建,可以选择美东,美东2,(其他感兴趣的区域可以查看下看支不支持这个功能https://azure.microsoft.com/zh-cn/global-infrastructure/services/),创建完成后在概述中记下Instrumentation Key,这个相当与告诉应用你要把log发到哪个application insights服务终结点(service endpoint)。
(3)参考https://pypi.org/project/applicationinsights/0.11.8/ 选择一个你想支持的Python版本,
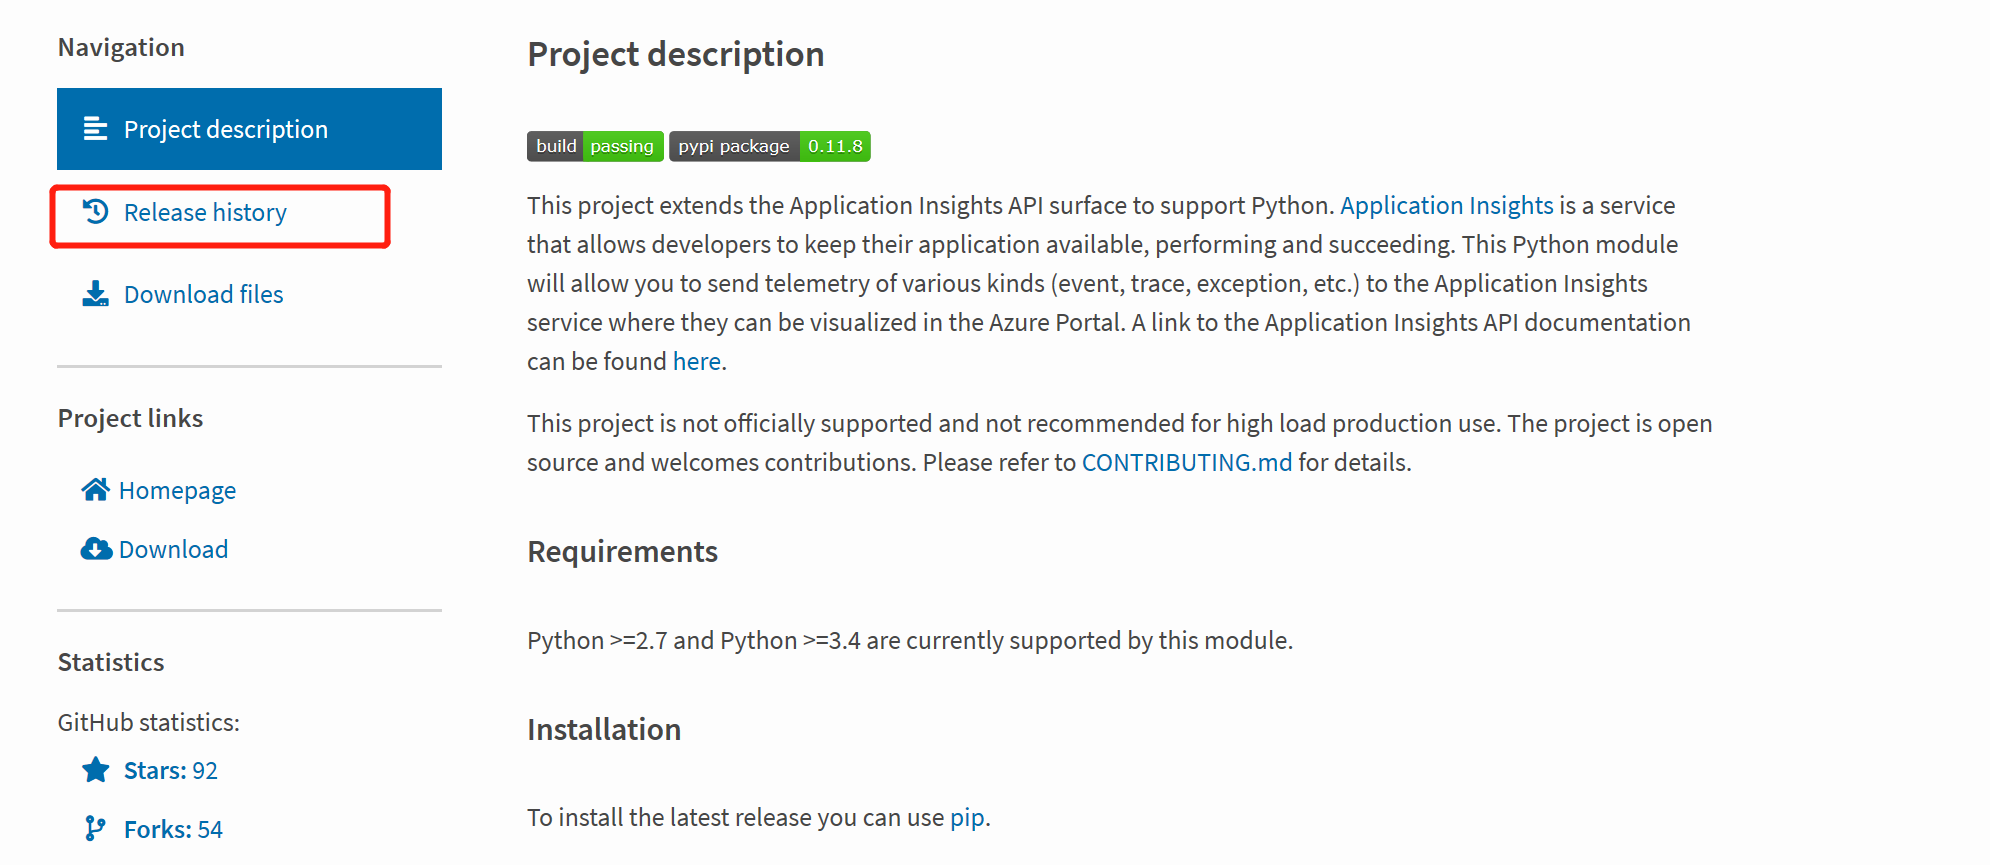
先调试你本地的程序没问题,然后安装:
pip install applicationinsights
在你的setting.py 里添加一个中间件:
'applicationinsights.django.ApplicationInsightsMiddleware'

然后添加:
APPLICATION_INSIGHTS = {
    # (required) Your Application Insights instrumentation key
    'ikey': "00000000-0000-0000-0000-000000000000",

    # (optional) By default, request names are logged as the request method
    # and relative path of the URL.  To log the fully-qualified view names
    # instead, set this to True.  Defaults to False.
    'use_view_name': True,

    # (optional) To log arguments passed into the views as custom properties,
    # set this to True.  Defaults to False.
    'record_view_arguments': True,

    # (optional) Exceptions are logged by default, to disable, set this to False.
    'log_exceptions': False,

    # (optional) Events are submitted to Application Insights asynchronously.
    # send_interval specifies how often the queue is checked for items to submit.
    # send_time specifies how long the sender waits for new input before recycling
    # the background thread.
    'send_interval': 1.0, # Check every second
    'send_time': 3.0, # Wait up to 3 seconds for an event

    # (optional, uncommon) If you must send to an endpoint other than the
    # default endpoint, specify it here:
    'endpoint': "https://dc.services.visualstudio.com/v2/track",
}
这里的ikey换成你上面记的Instrumentation Key,这样就能将一些event log,trace发到ApplicationInsights上作分析和监控。另外还可以和Django的logging做集成,把Django的warnings,errors日志拿到ApplicationInsights上统一分析与监控:
LOGGING = {
    'version': 1,
    'disable_existing_loggers': False,
    'handlers': {
        # The application insights handler is here
        'appinsights': {
            'class': 'applicationinsights.django.LoggingHandler',
            'level': 'WARNING'
        }
    },
    'loggers': {
        'django': {
            'handlers': ['appinsights'],
            'level': 'WARNING',
            'propagate': True,
        }
    }
}
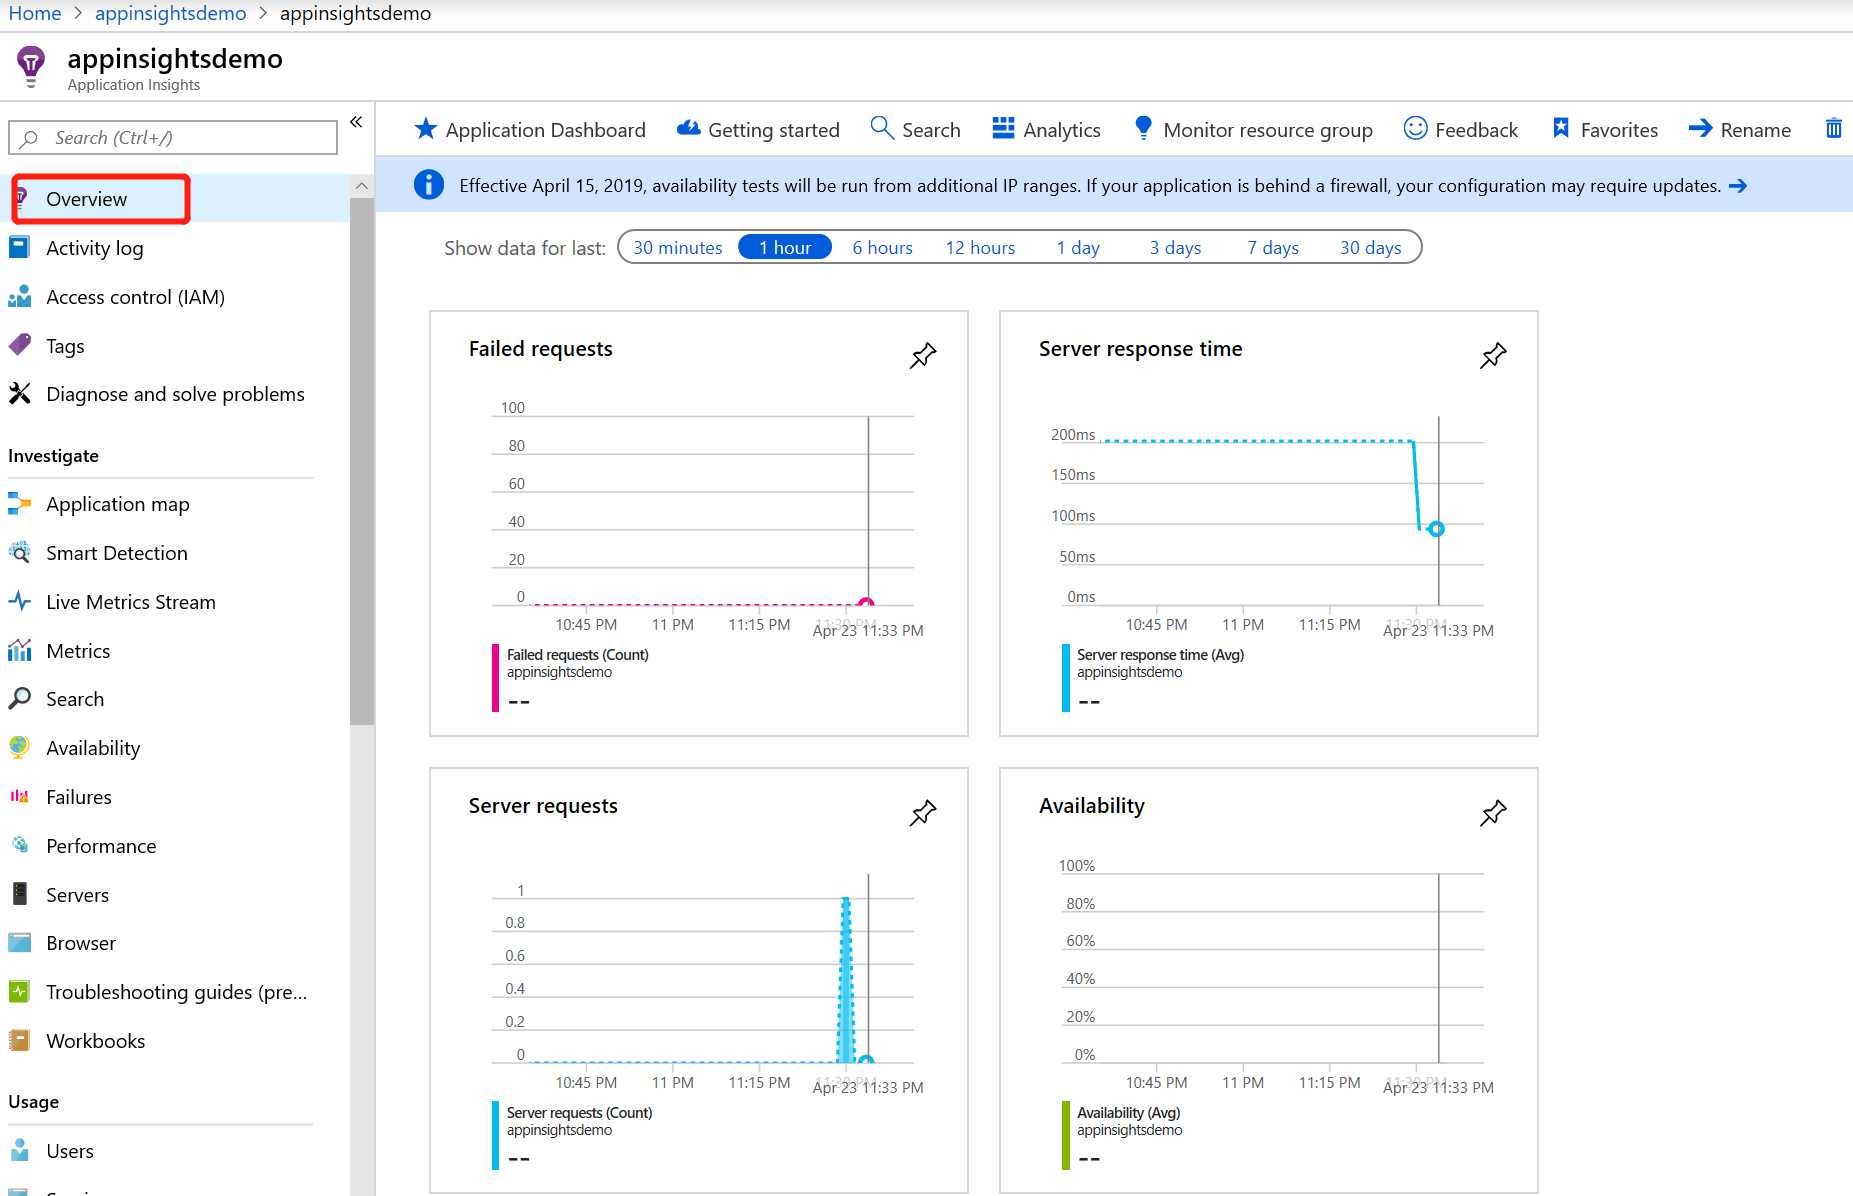
(4)上你刚创建的Azure Portal上查看:
概述中会将以下指标显示出来:
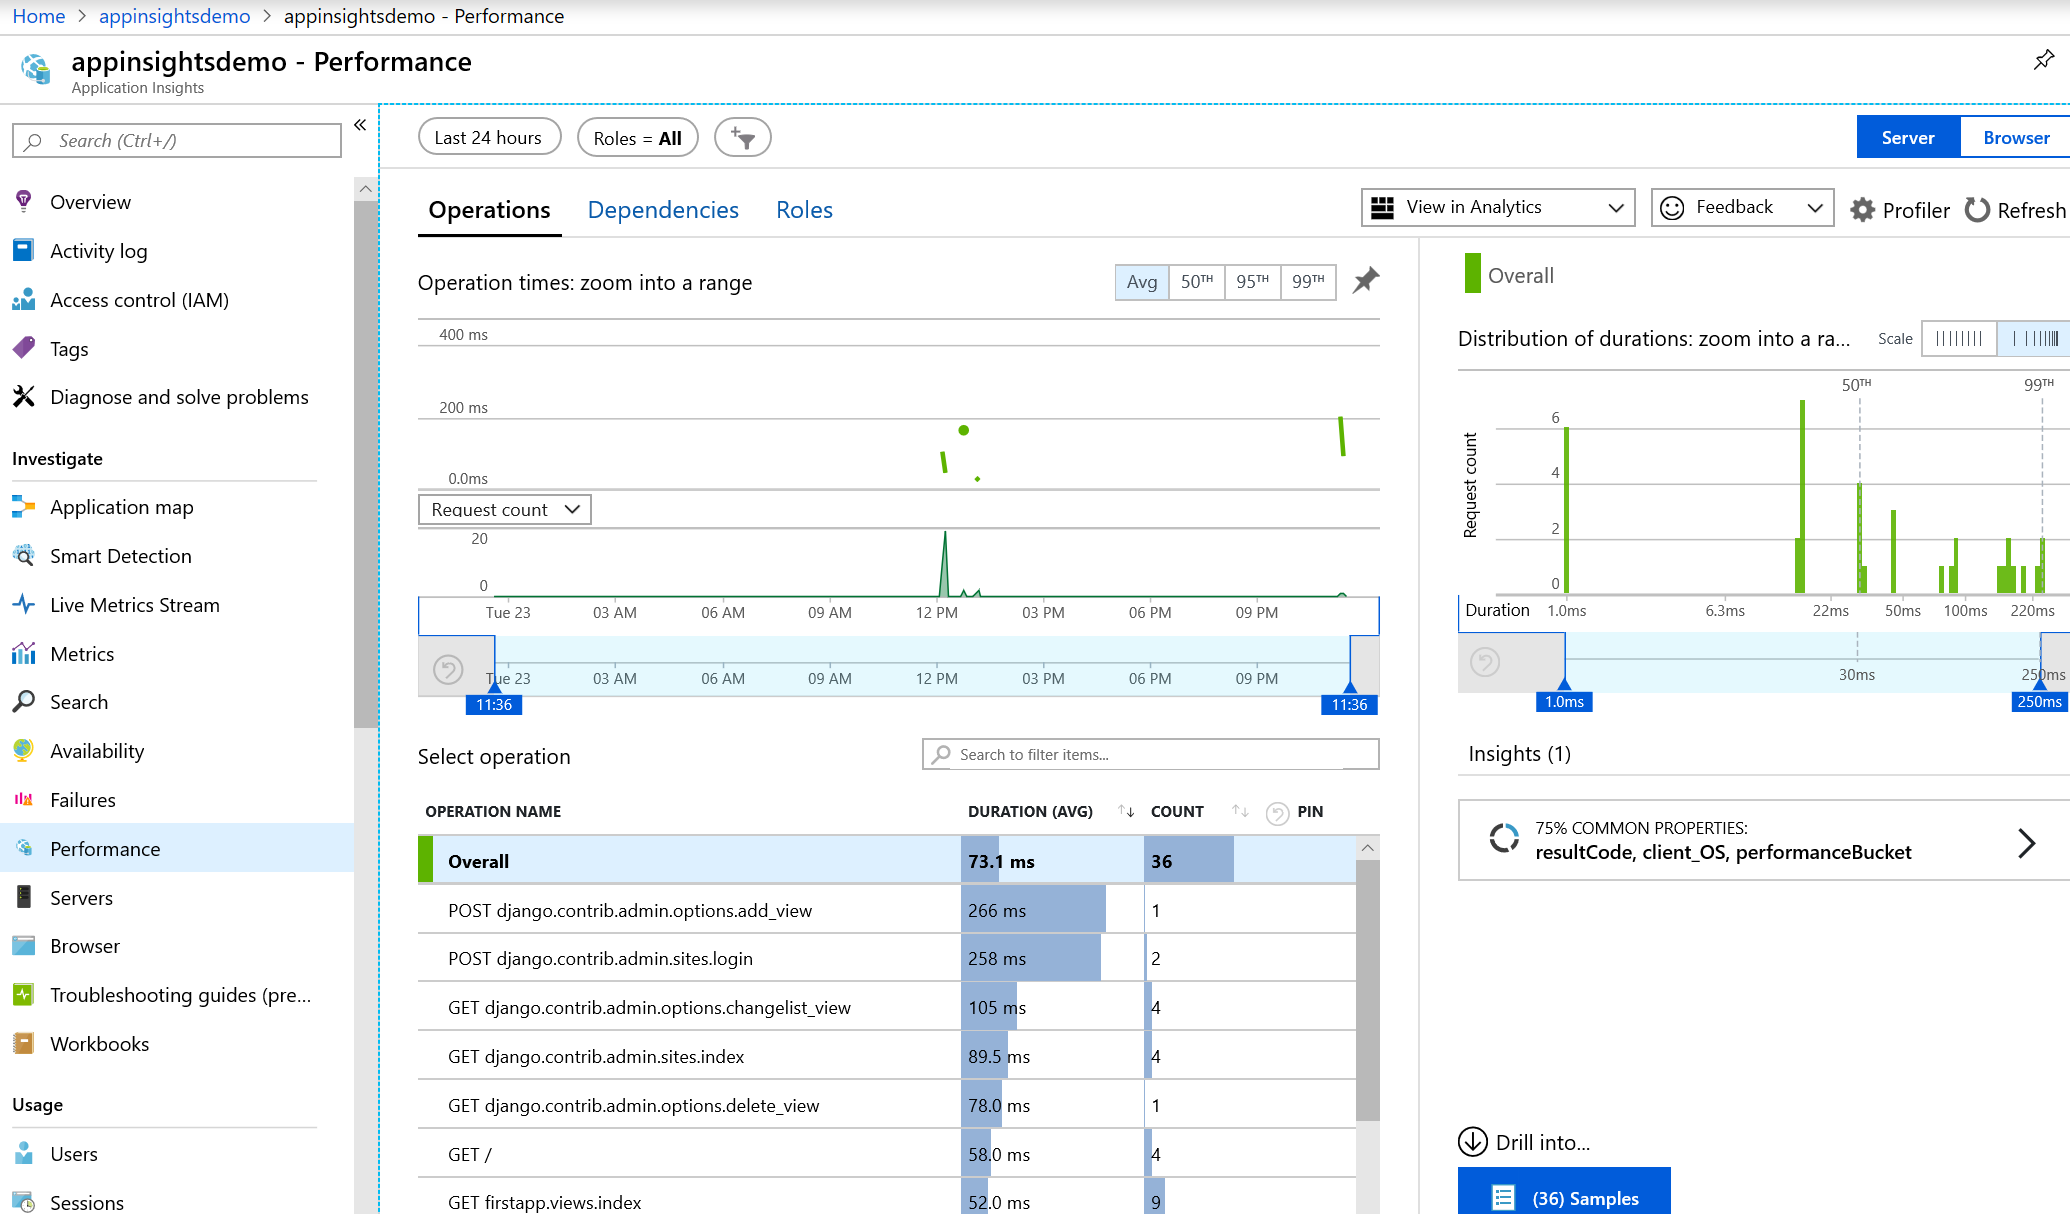
看下performance:
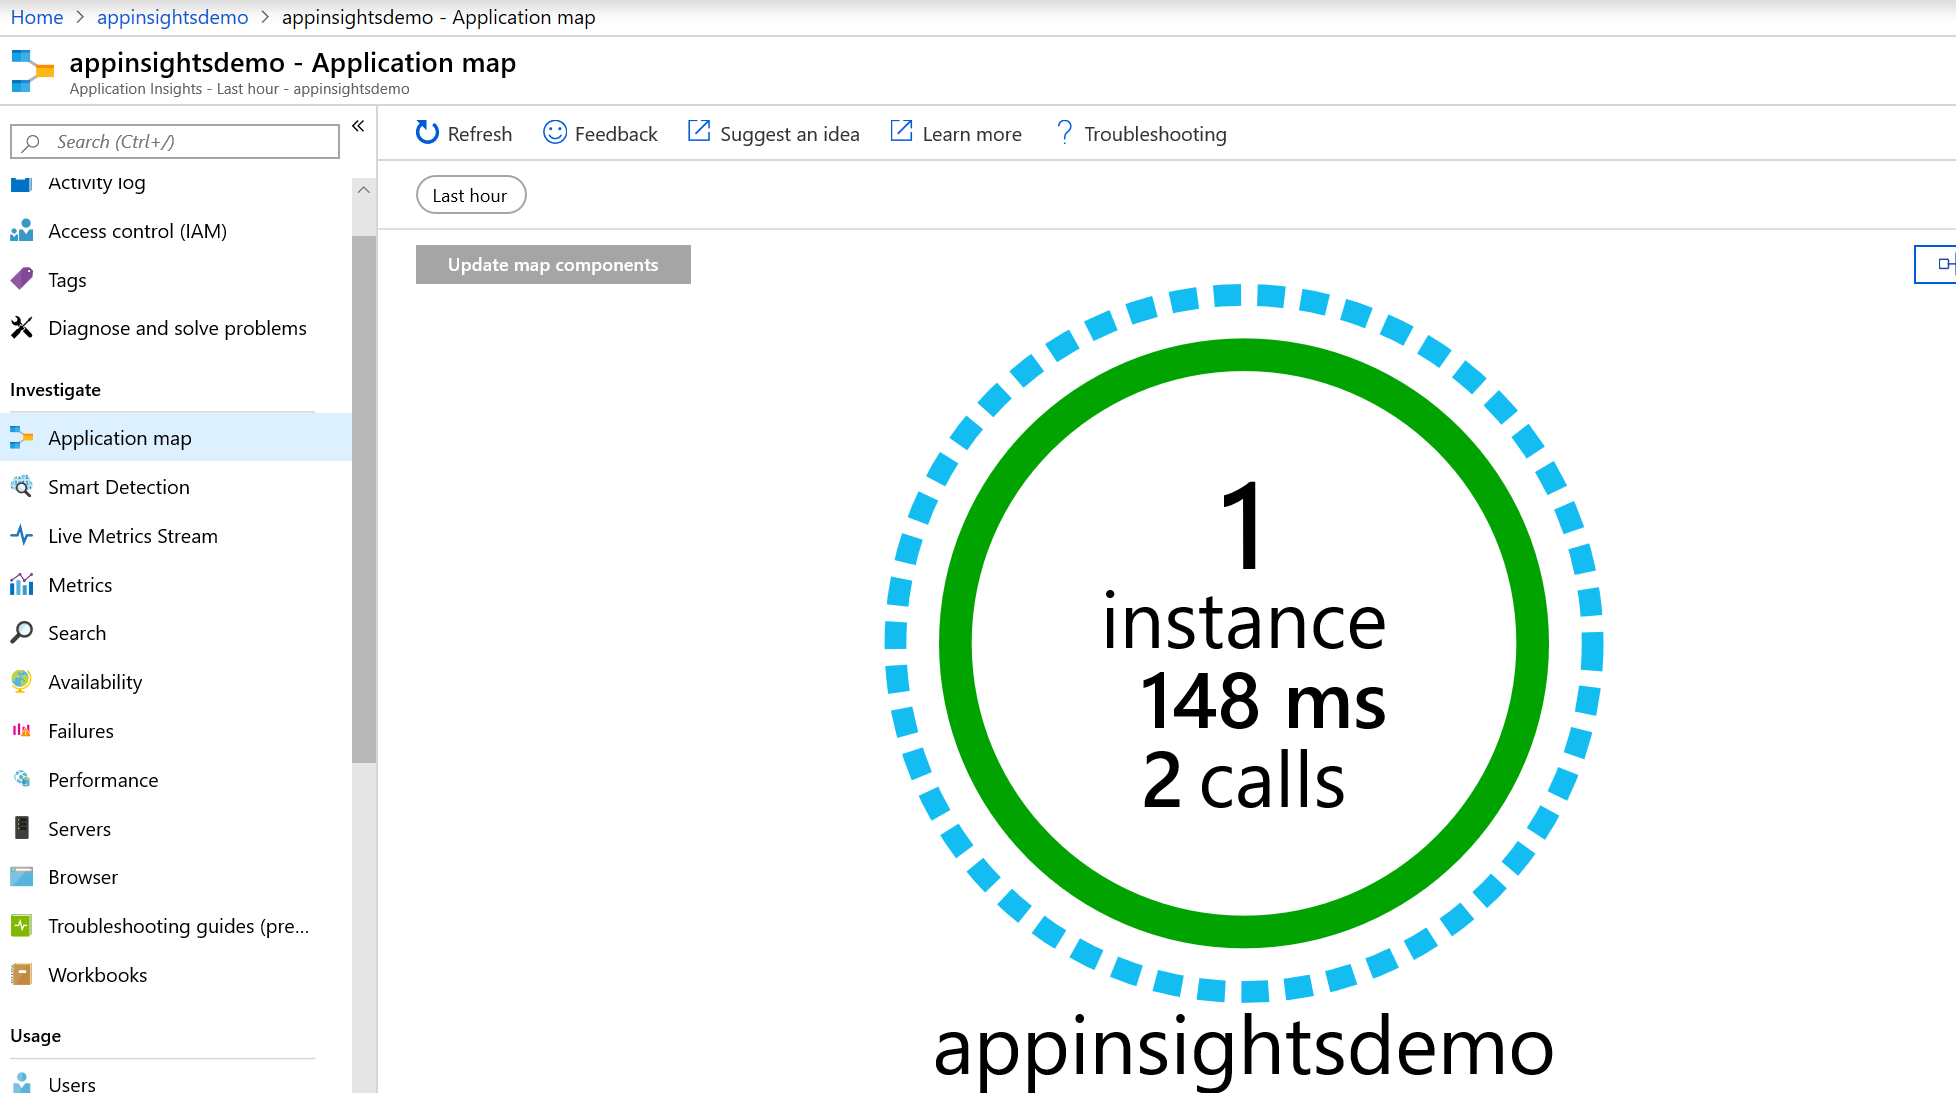
应用依赖情况:
session情况:

更多内容其实可以根据这篇操作自己搭一个体验一下怎么看。
至此一个本地Python应用的监控基本验证完成了,还是比较简单的配置,后面的文章会慢慢详细分析其中这些指标的内容和查询。