ELk(Elasticsearch, Logstash, Kibana)的安装配置
本文中所有的版本都是基于5.2.0,因为公司es(Elasticsearch)的环境是5.2.0。
1. Elasticsearch的安装-官网
关于Elasticsearch的安装在之前的文章中已经写过了,这里不再赘述。
[elasticsearch及head插件安装与配置](https://www.cnblogs.com/chaos-x/p/9446250.html)
2. Kibana的安装配置-官网
Kibana是一个能把你es中数据进行可视化显示的工具,包括实时统计和分析,基本上是零配置。
1. Kibana下载地址
Kibana 5.2.0 linux 64-bit tar.gz
wget https://artifacts.elastic.co/downloads/kibana/kibana-5.2.0-linux-x86_64.tar.gz
2.解压
tar -zxvf kibana-5.2.0-linux-x86_64.tar.gz
3. 配置
vim kibana-5.2.0-linux-x86_64/config/kibana.yml
# Kibana is served by a back end server. This setting specifies the port to use.
server.port: 30000

# Specifies the address to which the Kibana server will bind. IP addresses and host names are both valid values.
# The default is 'localhost', which usually means remote machines will not be able to connect.
# To allow connections from remote users, set this parameter to a non-loopback address.
server.host: "0.0.0.0"

# The URL of the Elasticsearch instance to use for all your queries.
# es的访问地址和商品号
elasticsearch.url: "http://localhost:19200"
- 启动
sh kibana-5.2.0-linux-x86_64/bin/kibana
在浏览器中访问Kibana的服务器加端口号就可以看到Kibana的页面了。
3. Logstash的安装配置-官网
Logstash是日志的收集工具,可以对日志进行收集,分析,解码,过滤,输出。一般使用Filebeat收集日志到Logstash,由Logstash处理后保存到es。关于Filebeat后面再说。
1. 下载
https://artifacts.elastic.co/downloads/logstash/logstash-5.2.0.tar.gz
wget https://artifacts.elastic.co/downloads/logstash/logstash-5.2.0.tar.gz
2. 解压
tar -zxvf logstash-5.2.0.tar.gz
3. 启动
sh logstash-5.2.0/bin/logstash -e 'input{stdin{}}output{stdout{codec=>rubydebug}}'
启动后输入'hello word',回车。会输出如下结果
{
       "message" => "Hello World",
      "@version" => "1",
    "@timestamp" => "2014-08-07T10:30:59.937Z",
          "host" => "raochenlindeMacBook-Air.local",
}
Logstash 会给事件添加一些额外信息。最重要的就是 @timestamp,用来标记事件的发生时间。因为这个字段涉及到 Logstash 的内部流转,所以必须是一个 joda 对象,如果你尝试自己给一个字符串字段重命名为 @timestamp 的话,Logstash 会直接报错。所以,请使用 filters/date 插件 来管理这个特殊字段。
4. 配置
可以把把配置写到一个文件中,来启动Logstash。
- 在Logstash的配置文件目录中创建
test.yml文件
cd logstash-5.2.0/config/
vim test.yml
- 配置文件内容
input{
    stdin{}
}
ouput{
    stdout{
        codec=>rubydebug
    }
}
- 启动
sh logstash-5.2.0/bin/logstash -f logstash-5.2.0/config/test.yml
可以达步骤3的效果。
4. 使用ELK收集nginx的访问日志
1.配置Logstash
- 在Logstash的配置文件目录中创建
nginx-log.yml文件
cd logstash-5.2.0/config/
vim nginx-log.yml
- 配置文件内容
input {
  file {  # 指定一个文件作为输入源
    path => "/usr/local/nginx/logs/access.log"  # 指定文件的路径
    start_position => "beginning"  # 指定何时开始收集,这时设置从文件的最开头收集
    type => "nginx"  # 定义日志类型,可自定义
  }
}
filter {  # 配置过滤器
    grok {
        match => { "message" => "%{IPORHOST:http_host} %{IPORHOST:clientip} - %{USERNAME:remote_user} [%{HTTPDATE:timestamp}] "(?:%{WORD:http_verb} %{NOTSPACE:http_request}(?: HTTP/%{NUMBER:http_version})?|%{DATA:raw_http_request})" %{NUMBER:response} (?:%{NUMBER:bytes_read}|-) %{QS:referrer} %{QS:agent} %{QS:xforwardedfor} %{NUMBER:request_time:float}"}  # 定义日志的输出格式
    }
    geoip {
        source => "clientip"
    }
}
output {
	# 标准输出,是输出到终端
    stdout { codec => rubydebug }
    # 输出到es
    elasticsearch {
        hosts => ["127.0.0.1:19200"]
        index => "nginx-log-%{+YYYY.MM.dd}"
  }
}
- 检查配置文件
sh logstash --path.settings /etc/logstash/ -f logstash-5.2.0/config/nginx-log.yml --config.test_and_exit
2. 配置nginx的配置文件
- 打开nginx的配置文件
vim /usr/local/nginx/conf/nginx.conf
- 在http中增加如下内容
http {
    include       mime.types;
    default_type  application/octet-stream;

    #log_format  main  '$remote_addr - $remote_user [$time_local] "$request" '
    #                  '$status $body_bytes_sent "$http_referer" '
    #                  '"$http_user_agent" "$http_x_forwarded_for"';

    log_format main2 '$http_host $remote_addr - $remote_user [$time_local] "$request" '
                      '$status $body_bytes_sent "$http_referer" '
                      '"$http_user_agent" "$upstream_addr" $request_time';
}
- 在要格式化日志的 server中增加如下配置
 		#access_log  logs/host.access.log  main;
        # 增加如下内容, 日志格式化main2要在上面定义,不然这里无法引用
        access_log  logs/elk_access.log  main2;

        location / {
            root   html;
            index  index.html index.htm;
            # 增加如下三行内容,分别是携带访问host,远程地址和各层代理地址
            proxy_set_header Host   $host;
            proxy_set_header X-Real-IP      $remote_addr;
            proxy_set_header X-Forwarded-For $proxy_add_x_forwarded_for;

        }
- 重启nginx
sh /usr/local/nginx/sbin/nginx -s reload
3. 检查启动
- 检查
sh logstash-5.2.0/bin/logstash -f logstash-5.2.0/config/nginx-log.yml --config.test_and_exit
- 启动
sh logstash-5.2.0/bin/logstash -f logstash-5.2.0/config/nginx-log.yml
当终端输出如下内容就成功了
{
         "@timestamp" => 2018-12-18T08:44:56.361Z,
    "plugin_instance" => "vda",
               "read" => 467266,
             "plugin" => "disk",
               "host" => "172.24.121.18",
           "@version" => "1",
      "collectd_type" => "disk_ops",
               "type" => "collectd",
              "write" => 12204609
}
{
         "longterm" => 0.08,
       "@timestamp" => 2018-12-18T08:44:46.362Z,
           "plugin" => "load",
        "shortterm" => 0.06,
             "host" => "172.24.121.18",
         "@version" => "1",
    "collectd_type" => "load",
             "type" => "collectd",
          "midterm" => 0.04
}
5. Kibana展示nginx访问日志
进入Kibana页面如下

- 配置Index Patterns
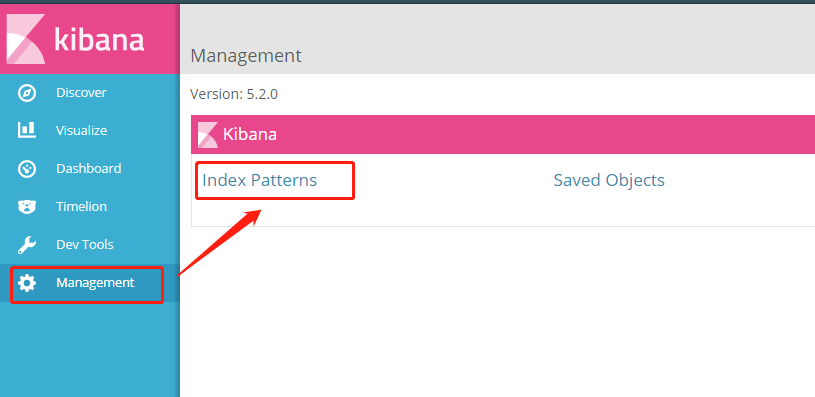
- 进入后点击左上角的 ‘add new’ 进行创建索引模板
在Kibana中,要分析展示数据时,要先创建Index Patterns

选择index的时候可以用通配符 ‘*’ 来把所有的nginx-log的访问日志分成一个组。
Time-field name 是要指定一个日期格式的字段,以便于后面统计使用。
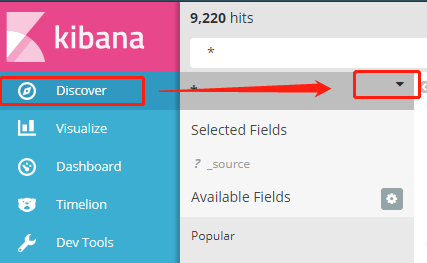
然后就可以在这里选择配置好的Index patterns了。

其中x轴的时间就是创建Index Patterns的时候选择的那个日期字段。
参考:
本文中所有的版本都是基于5.2.0,因为公司es(Elasticsearch)的环境是5.2.0。
1. Elasticsearch的安装-官网
关于Elasticsearch的安装在之前的文章中已经写过了,这里不再赘述。
[elasticsearch及head插件安装与配置](https://www.cnblogs.com/chaos-x/p/9446250.html)
2. Kibana的安装配置-官网
Kibana是一个能把你es中数据进行可视化显示的工具,包括实时统计和分析,基本上是零配置。
1. Kibana下载地址
Kibana 5.2.0 linux 64-bit tar.gz
wget https://artifacts.elastic.co/downloads/kibana/kibana-5.2.0-linux-x86_64.tar.gz
2.解压
tar -zxvf kibana-5.2.0-linux-x86_64.tar.gz
3. 配置
vim kibana-5.2.0-linux-x86_64/config/kibana.yml
# Kibana is served by a back end server. This setting specifies the port to use.
server.port: 30000

# Specifies the address to which the Kibana server will bind. IP addresses and host names are both valid values.
# The default is 'localhost', which usually means remote machines will not be able to connect.
# To allow connections from remote users, set this parameter to a non-loopback address.
server.host: "0.0.0.0"

# The URL of the Elasticsearch instance to use for all your queries.
# es的访问地址和商品号
elasticsearch.url: "http://localhost:19200"
- 启动
sh kibana-5.2.0-linux-x86_64/bin/kibana
在浏览器中访问Kibana的服务器加端口号就可以看到Kibana的页面了。
3. Logstash的安装配置-官网
Logstash是日志的收集工具,可以对日志进行收集,分析,解码,过滤,输出。一般使用Filebeat收集日志到Logstash,由Logstash处理后保存到es。关于Filebeat后面再说。
1. 下载
https://artifacts.elastic.co/downloads/logstash/logstash-5.2.0.tar.gz
wget https://artifacts.elastic.co/downloads/logstash/logstash-5.2.0.tar.gz
2. 解压
tar -zxvf logstash-5.2.0.tar.gz
3. 启动
sh logstash-5.2.0/bin/logstash -e 'input{stdin{}}output{stdout{codec=>rubydebug}}'
启动后输入'hello word',回车。会输出如下结果
{
       "message" => "Hello World",
      "@version" => "1",
    "@timestamp" => "2014-08-07T10:30:59.937Z",
          "host" => "raochenlindeMacBook-Air.local",
}
Logstash 会给事件添加一些额外信息。最重要的就是 @timestamp,用来标记事件的发生时间。因为这个字段涉及到 Logstash 的内部流转,所以必须是一个 joda 对象,如果你尝试自己给一个字符串字段重命名为 @timestamp 的话,Logstash 会直接报错。所以,请使用 filters/date 插件 来管理这个特殊字段。
4. 配置
可以把把配置写到一个文件中,来启动Logstash。
- 在Logstash的配置文件目录中创建
test.yml文件
cd logstash-5.2.0/config/
vim test.yml
- 配置文件内容
input{
    stdin{}
}
ouput{
    stdout{
        codec=>rubydebug
    }
}
- 启动
sh logstash-5.2.0/bin/logstash -f logstash-5.2.0/config/test.yml
可以达步骤3的效果。
4. 使用ELK收集nginx的访问日志
1.配置Logstash
- 在Logstash的配置文件目录中创建
nginx-log.yml文件
cd logstash-5.2.0/config/
vim nginx-log.yml
- 配置文件内容
input {
  file {  # 指定一个文件作为输入源
    path => "/usr/local/nginx/logs/access.log"  # 指定文件的路径
    start_position => "beginning"  # 指定何时开始收集,这时设置从文件的最开头收集
    type => "nginx"  # 定义日志类型,可自定义
  }
}
filter {  # 配置过滤器
    grok {
        match => { "message" => "%{IPORHOST:http_host} %{IPORHOST:clientip} - %{USERNAME:remote_user} [%{HTTPDATE:timestamp}] "(?:%{WORD:http_verb} %{NOTSPACE:http_request}(?: HTTP/%{NUMBER:http_version})?|%{DATA:raw_http_request})" %{NUMBER:response} (?:%{NUMBER:bytes_read}|-) %{QS:referrer} %{QS:agent} %{QS:xforwardedfor} %{NUMBER:request_time:float}"}  # 定义日志的输出格式
    }
    geoip {
        source => "clientip"
    }
}
output {
	# 标准输出,是输出到终端
    stdout { codec => rubydebug }
    # 输出到es
    elasticsearch {
        hosts => ["127.0.0.1:19200"]
        index => "nginx-log-%{+YYYY.MM.dd}"
  }
}
- 检查配置文件
sh logstash --path.settings /etc/logstash/ -f logstash-5.2.0/config/nginx-log.yml --config.test_and_exit
2. 配置nginx的配置文件
- 打开nginx的配置文件
vim /usr/local/nginx/conf/nginx.conf
- 在http中增加如下内容
http {
    include       mime.types;
    default_type  application/octet-stream;

    #log_format  main  '$remote_addr - $remote_user [$time_local] "$request" '
    #                  '$status $body_bytes_sent "$http_referer" '
    #                  '"$http_user_agent" "$http_x_forwarded_for"';

    log_format main2 '$http_host $remote_addr - $remote_user [$time_local] "$request" '
                      '$status $body_bytes_sent "$http_referer" '
                      '"$http_user_agent" "$upstream_addr" $request_time';
}
- 在要格式化日志的 server中增加如下配置
 		#access_log  logs/host.access.log  main;
        # 增加如下内容, 日志格式化main2要在上面定义,不然这里无法引用
        access_log  logs/elk_access.log  main2;

        location / {
            root   html;
            index  index.html index.htm;
            # 增加如下三行内容,分别是携带访问host,远程地址和各层代理地址
            proxy_set_header Host   $host;
            proxy_set_header X-Real-IP      $remote_addr;
            proxy_set_header X-Forwarded-For $proxy_add_x_forwarded_for;

        }
- 重启nginx
sh /usr/local/nginx/sbin/nginx -s reload
3. 检查启动
- 检查
sh logstash-5.2.0/bin/logstash -f logstash-5.2.0/config/nginx-log.yml --config.test_and_exit
- 启动
sh logstash-5.2.0/bin/logstash -f logstash-5.2.0/config/nginx-log.yml
当终端输出如下内容就成功了
{
         "@timestamp" => 2018-12-18T08:44:56.361Z,
    "plugin_instance" => "vda",
               "read" => 467266,
             "plugin" => "disk",
               "host" => "172.24.121.18",
           "@version" => "1",
      "collectd_type" => "disk_ops",
               "type" => "collectd",
              "write" => 12204609
}
{
         "longterm" => 0.08,
       "@timestamp" => 2018-12-18T08:44:46.362Z,
           "plugin" => "load",
        "shortterm" => 0.06,
             "host" => "172.24.121.18",
         "@version" => "1",
    "collectd_type" => "load",
             "type" => "collectd",
          "midterm" => 0.04
}
5. Kibana展示nginx访问日志
进入Kibana页面如下
- 配置Index Patterns
- 进入后点击左上角的 ‘add new’ 进行创建索引模板
在Kibana中,要分析展示数据时,要先创建Index Patterns
选择index的时候可以用通配符 ‘*’ 来把所有的nginx-log的访问日志分成一个组。
Time-field name 是要指定一个日期格式的字段,以便于后面统计使用。
然后就可以在这里选择配置好的Index patterns了。
其中x轴的时间就是创建Index Patterns的时候选择的那个日期字段。
参考: