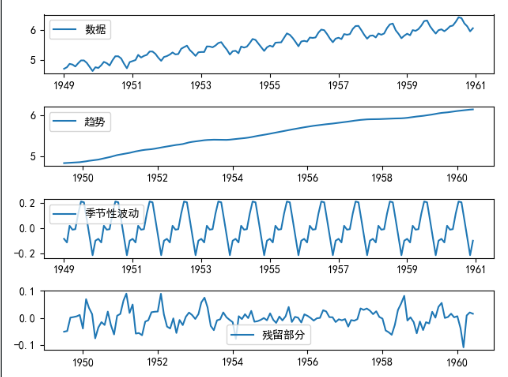
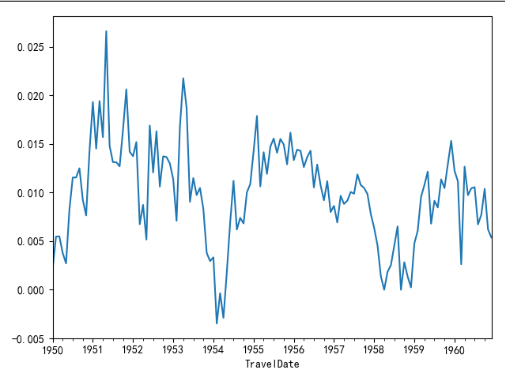
1.继续使用statsmodels作为计算库
上一篇已经说了下一步要干什么,这里直接给代码
def decompose(timeserise):
    decomposition = seasonal_decompose(timeserise)
    # 趋势
    trend = decomposition.trend
    # 季节性
    seasonal = decomposition.seasonal
    # 残留部分
    residual = decomposition.resid
    # 成分分解绘图部分
    plt.subplot(411)
    plt.plot(ts_log, label="数据")
    plt.legend(loc='best')
    plt.subplot(412)
    plt.plot(trend, label="趋势")
    plt.legend(loc='best')
    plt.subplot(413)
    plt.plot(seasonal, label="季节性波动")
    plt.legend(loc='best')
    plt.subplot(414)
    plt.plot(residual, label="残留部分")
    plt.legend(loc='best')
    plt.tight_layout()
    plt.show()
    return trend, seasonal, residual


if __name__ == '__main__':
    draw_rend(ts, 12)
    res = teststationayity(ts)
    print(res)
    # 数据对数变换 为了df平稳性校验
    ts_log = np.log(ts)
    draw_moving(ts_log, 12)
    # 分解图
    trend, seasonal, residual = decompose(ts_log)
    #参数整理
    print("#############")
    rol_mean=ts_log.rolling(window=12).mean()
    rol_mean.dropna(inplace=True)#drop掉nan
    ts_diff_1=rol_mean.diff(1)
    ts_diff_1.dropna(inplace=True)
(1)分解图

(2)一阶差分

2.再次df检验
复用上次代码
res2=teststationayity(ts_diff_1)
    print(res2)
得到返回值:
Test Statistic 0.815369
p_value 0.991880
#Lags Used 13.000000
Number of Observation Uesd 130.000000
Critical Value(1%) -3.481682
Critical Value(5%) -2.884042
Critical Value(10%) -2.578770
dtype: float64
######对比线#######
Test Statistic -2.709577
p_value 0.072396
#Lags Used 12.000000
Number of Observation Uesd 119.000000
Critical Value(1%) -3.486535
Critical Value(5%) -2.886151
Critical Value(10%) -2.579896
dtype: float64
这里可明显看到p值在数据处理后趋于0,统计值回落到%5~%10。
2020-06-01