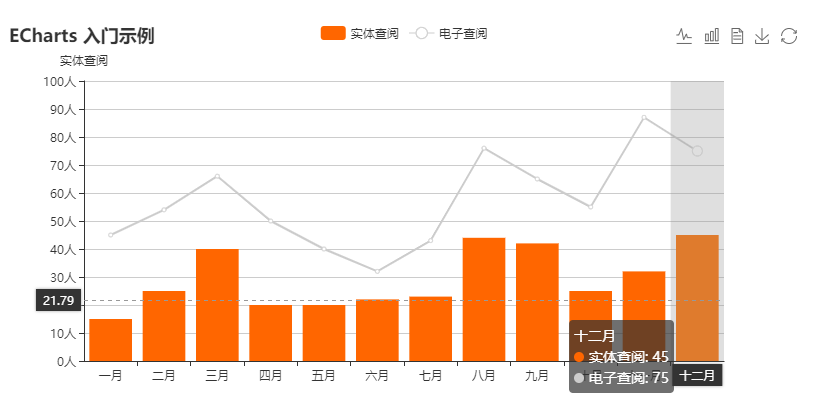
基础的图表和基础的配置。 效果图如下:

1、安装图表依赖包:npm install echarts
2、在main.js里面 引入echarts
import echarts from 'echarts'
Vue.prototype.$echarts = echarts
3、直接使用,配置和代码如下。
<template>
    <div class="box">
        <div id="myChart" :style="{ '800px', height: '400px'}"></div>
    </div>
</template>

<script>
export default {
    mounted(){
        this.drawLine();
    },
    methods: {
        drawLine(){
            // 基于准备好的dom,初始化echarts实例
            var myChart = this.$echarts.init(document.getElementById('myChart'));
            // 绘制图表
            myChart.setOption({
                title: {
                    text: 'ECharts 入门示例'
                },
                //提示框组件,专门配置提示框的。
                tooltip: {
                    trigger:'axis',
                    // 坐标轴指示器配置项。
                    axisPointer:{
                        type:'cross', //指示器样试
                    }
                },
                //工具栏。内置有导出图片,数据视图,动态类型切换,数据区域缩放,重置五个工具。
                toolbox:{
                    feature:{
                        // 动态类型切换,切换图表
                        magicType: {
                            type: ['line', 'bar', ]
                        },
                        //数据视图工具,可以展现当前图表所用的数据,编辑后可以动态更新。
                        dataView:{
                            show:true,  //是否显示 数据示图
                            readOnly:false, //是否 直接可以编辑数据。
                        },
                        //保存为图片的配置
                        saveAsImage: {
                            show: true
                        },
                        //配置项还原
                        restore: {show: true},
                    }
                },
                //图例组件展现了不同系列的标记(symbol),颜色和名字。可以通过点击图例控制哪些系列不显示。
                legend:{
                    data:['实体查阅','电子查阅'] //对应的是name
                },
                //配置X轴
                xAxis: {
                    //坐标轴类型
                    type:'category',
                    //配置类目名称。 可以逐一设置,具体看文档
                    data: ['一月', '二月', '三月', '四月', '五月', '六月','七月','八月','九月','十月','十一月','十二月'],
                    //配置 鼠标移入时显示的 阴影指示器'line' 直线指示器 'shadow' 阴影指示,器  'none' 无指示器
                    axisPointer: {
                        show:true, //show 必须写,开关的作用
                        type: 'shadow'
                    }
                },
                //配置Y轴
                yAxis: [
                    {
                        type: 'value', //坐标轴类型
                        name: '实体查阅', //名称
                        min: 0, //最小值
                        max: 100, //最大值
                        interval: 10, //列数
                        axisLabel: {  //坐标轴刻度标签的相关设置。
                            formatter: '{value}人'  //字符串模板
                        }
                    },
                ],
                //系列列表。每个系列通过 type 决定自己的图表类型,一个对象表示一个列表
                series: [
                    {
                        name: '实体查阅',
                        type: 'bar',
                        data: [15, 25, 40, 20, 20, 22,23,44,42,25,32,45],
                        itemStyle:{ //图形的颜色。默认指向全局的option.color
                            color:'#F60'
                        }
                    },
                    {
                        name: '电子查阅',
                        type: 'line',
                        data: [45, 54, 66, 50, 40, 32,43,76,65,55,87,75]
                    }
                ],
                //图表的颜色
                color:['#CCC','#AFA', '#61a0a8', '#d48265', '#91c7ae','#749f83',  '#ca8622', '#bda29a','#6e7074', '#546570', '#c4ccd3']
            });
            //鼠标事件
            myChart.on('click',function(params){
                console.log(params)
            })
        }
    },
}

</script>

<style scoped>
.box{
    margin-top:50px;
}
</style>
4、饼图配置和说明,以及效果图

<template>
    <div class="box">
        <div id="pieChart"></div>
    </div>
</template>

<script>
export default {
    mounted(){
        this.chartFn()
    },
    methods:{
        chartFn(){
            // 基于准备好的dom,初始化echarts实例
            var pieChart = this.$echarts.init(document.getElementById('pieChart'));
            pieChart.setOption({
                title:{
                    text:'饼图', //标题
                    subtext: '练习专用',  //副标题
                    x:'center'  // 位置
                },
                legend: {
                    orient: 'vertical', //图例列表的布局朝向。
                    left: 'left', //距离左侧的距离
                    data: ['直接访问','邮件营销','联盟广告','视频广告','搜索引擎']
                },
                series : [
                    {
                        name: '访问来源',
                        type: 'pie', //类型
                        radius : '60%', //饼图的半径
                        center: ['50%', '60%'], //饼图位置的中心(圆心)坐标,数组的第一项是横坐标,第二项是纵坐标。
                        data:[
                            {value:335, name:'直接访问'},
                            {value:310, name:'邮件营销'},
                            {value:234, name:'联盟广告'},
                            {value:135, name:'视频广告'},
                            {value:1548, name:'搜索引擎'}
                        ],
                    }
                ]
            })
        }
    }
}
</script>

<style scoped>
.box{
    margin-top:50px;
}
#pieChart{
    500px;
    height:500px;
}
</style>