loki、promtail、Grafana安装包
链接:https://pan.baidu.com/s/1vkSa_KYrXM0UEI8i42KdaA
提取码:4d4q
如果安装失败或者下载速度慢可以直接去官网下载
------------------------------------------------------
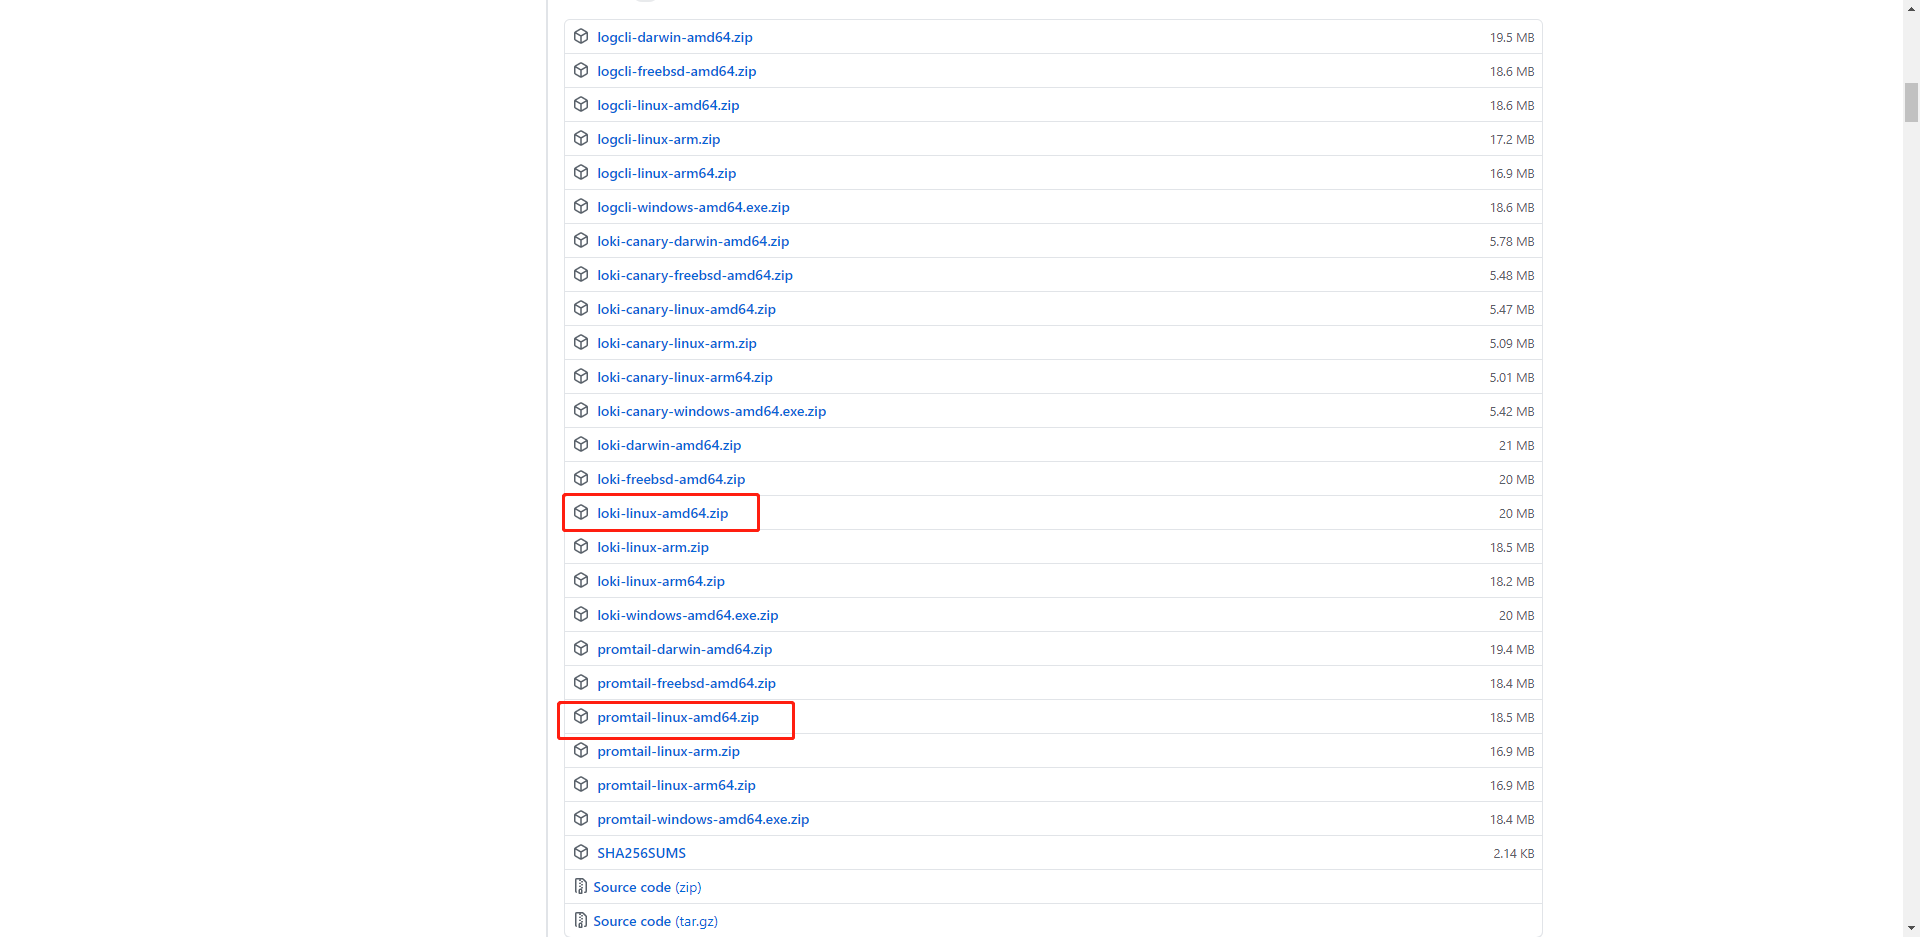
loki官网 https://github.com/grafana/loki/releases/
配置文件官网 https://grafana.com/docs/loki/latest/installation/local/
配置文件下载
wget https://raw.githubusercontent.com/grafana/loki/master/cmd/loki/loki-local-config.yaml
wget https://raw.githubusercontent.com/grafana/loki/master/cmd/promtail/promtail-local-config.yaml
------------------------------------------------------
grafana 下载
wget https://dl.grafana.com/oss/release/grafana-7.2.0-1.x86_64.rpm
sudo yum install grafana-7.2.0-1.x86_64.rpm
grafana 下载官网 https://grafana.com/grafana/download
------------------------------------------------------
下载完之后解压

执行命令 单个执行
./loki-linux-amd64 -config.file=./etc/loki-local-config.yaml
./promtail-linux-amd64 -config.file=./etc/promtail-local-config.yaml
./grafana-server web
后台执行命令为
nohup ./loki-linux-amd64 -config.file=./etc/loki-local-config.yaml & nohup ./promtail-linux-amd64 -config.file=./etc/promtail-local-config.yaml & nohup ./grafana-7.1.1/bin/grafana-server web &
grafana访问为 http://localhost:3000
如果访问失败,很大概率是grafana启动失败
这个时候可以查看端口号是否开启 netstat -anp | grep 3000
如果没有,则进入到 ./grafana-7.1.1/bin/
执行 ./grafana-server web
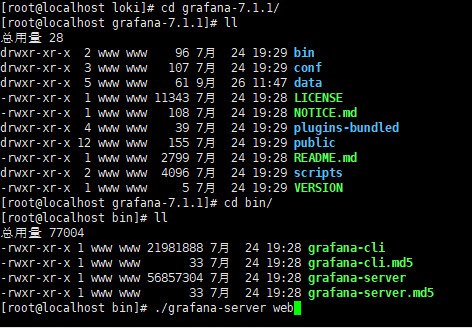
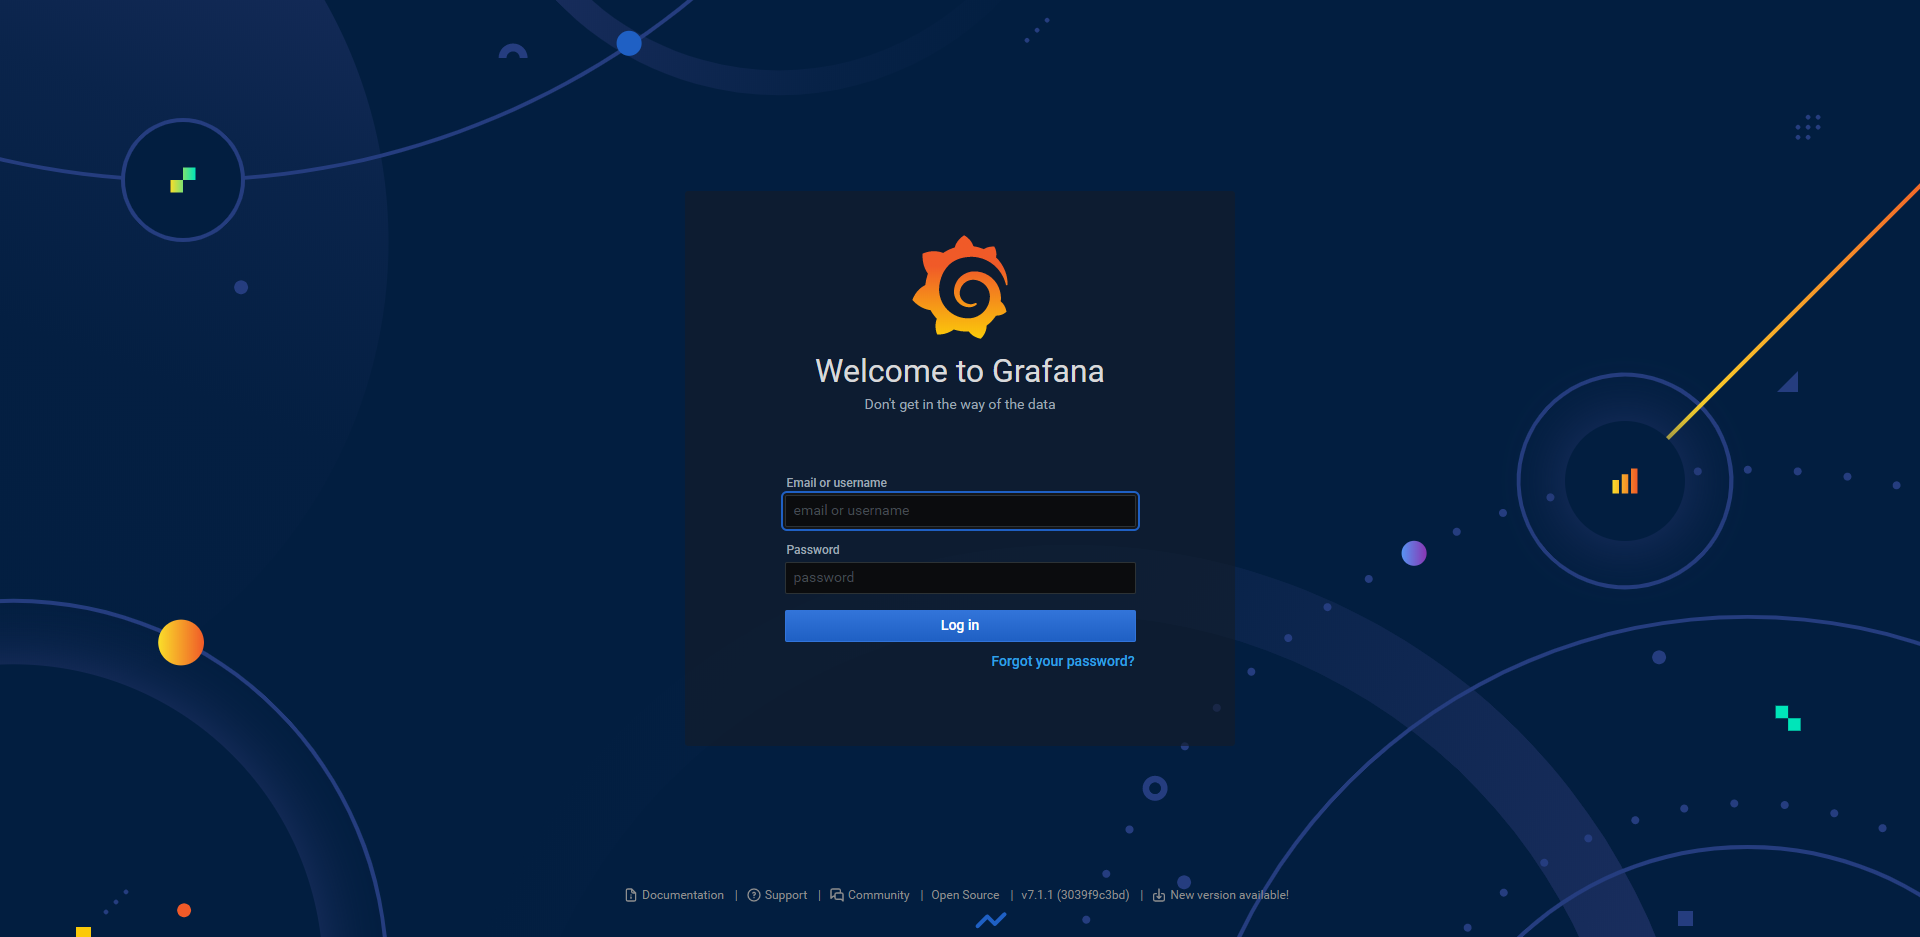
执行成功进入到grafana登录页面。
默认账号密码都是admin
首次进入会提示修改密码。看清楚输入框。
创建一个data sources
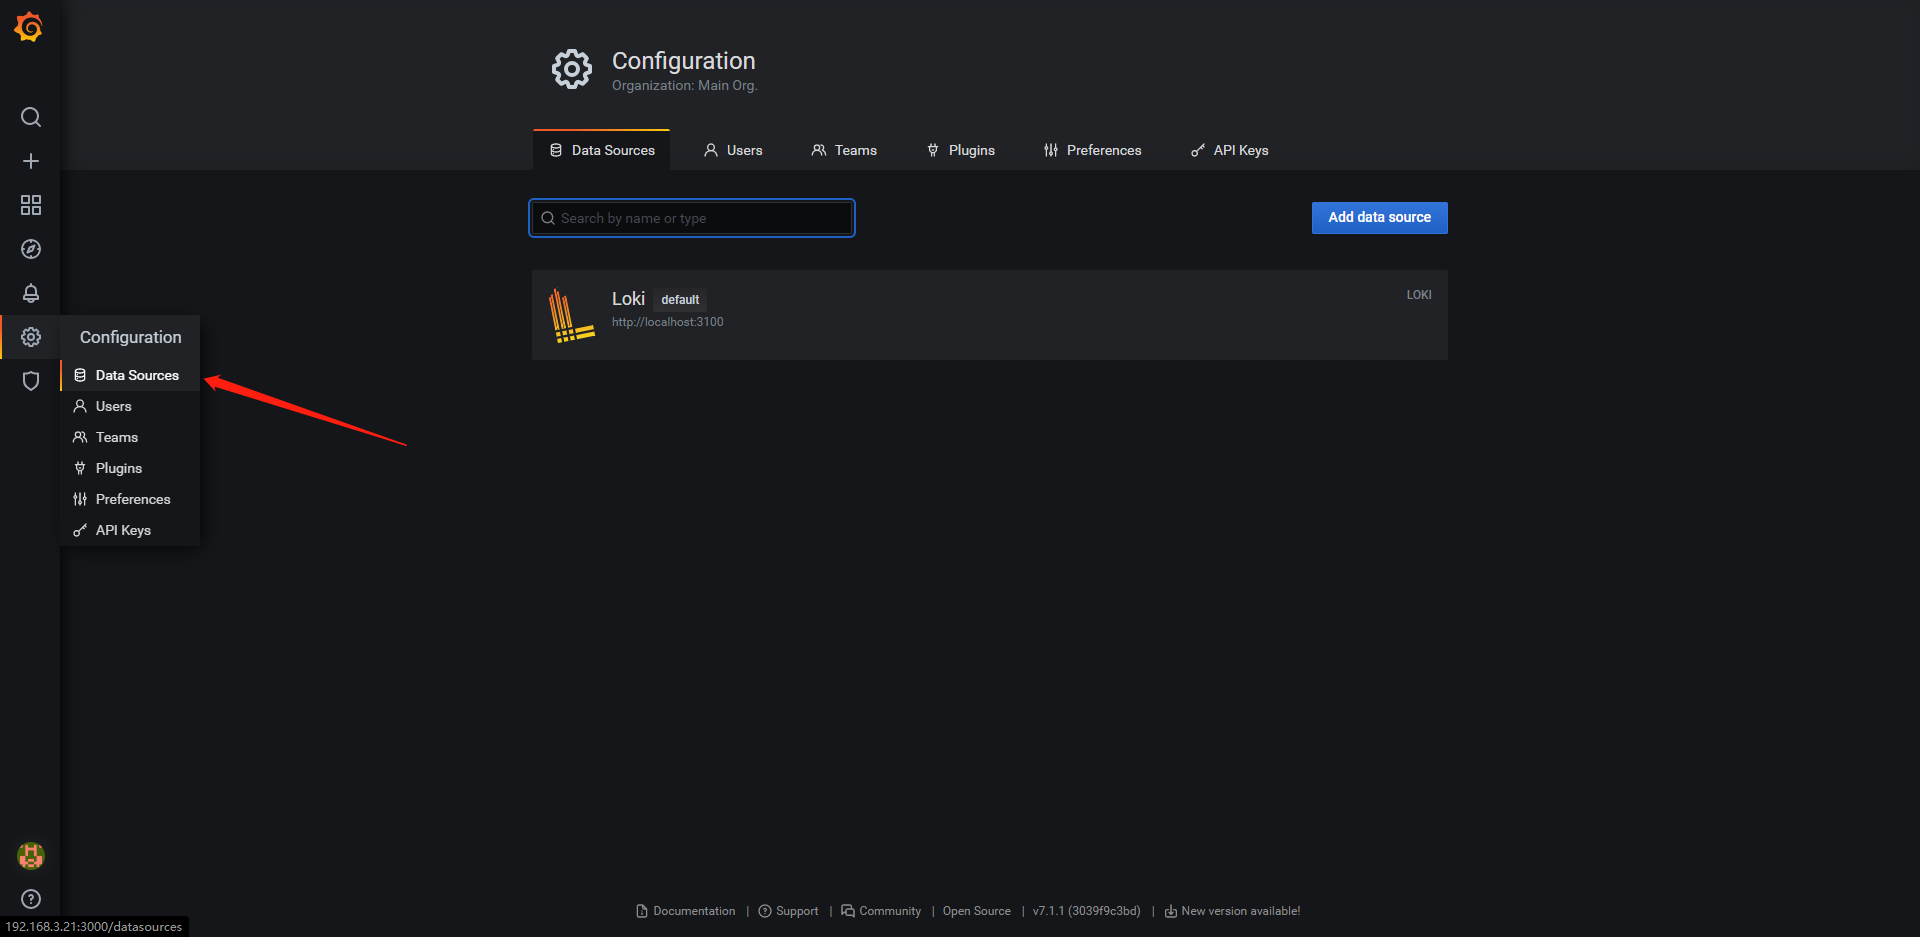
这里填写的是loki的链接,这个链接可以访问,正常是返回数据,但有时候也可能返回404。目前没发现影响使用的地方
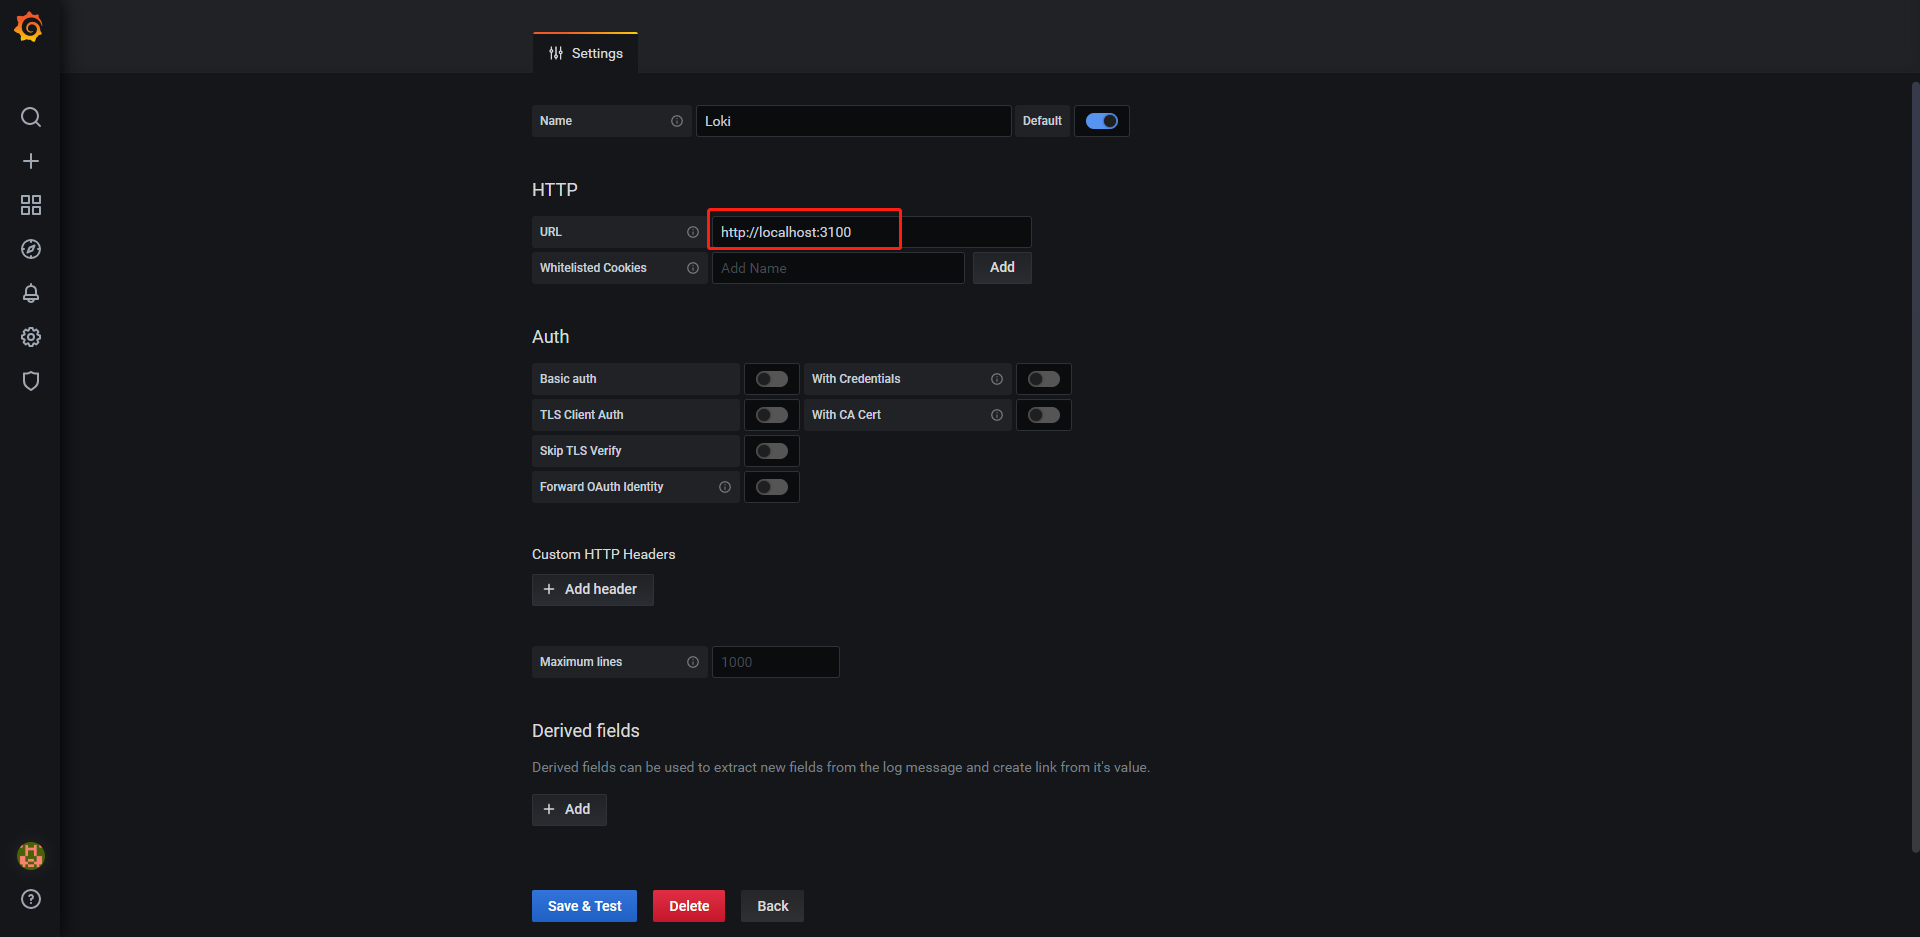
保存成功的提示是两个绿色的弹窗success
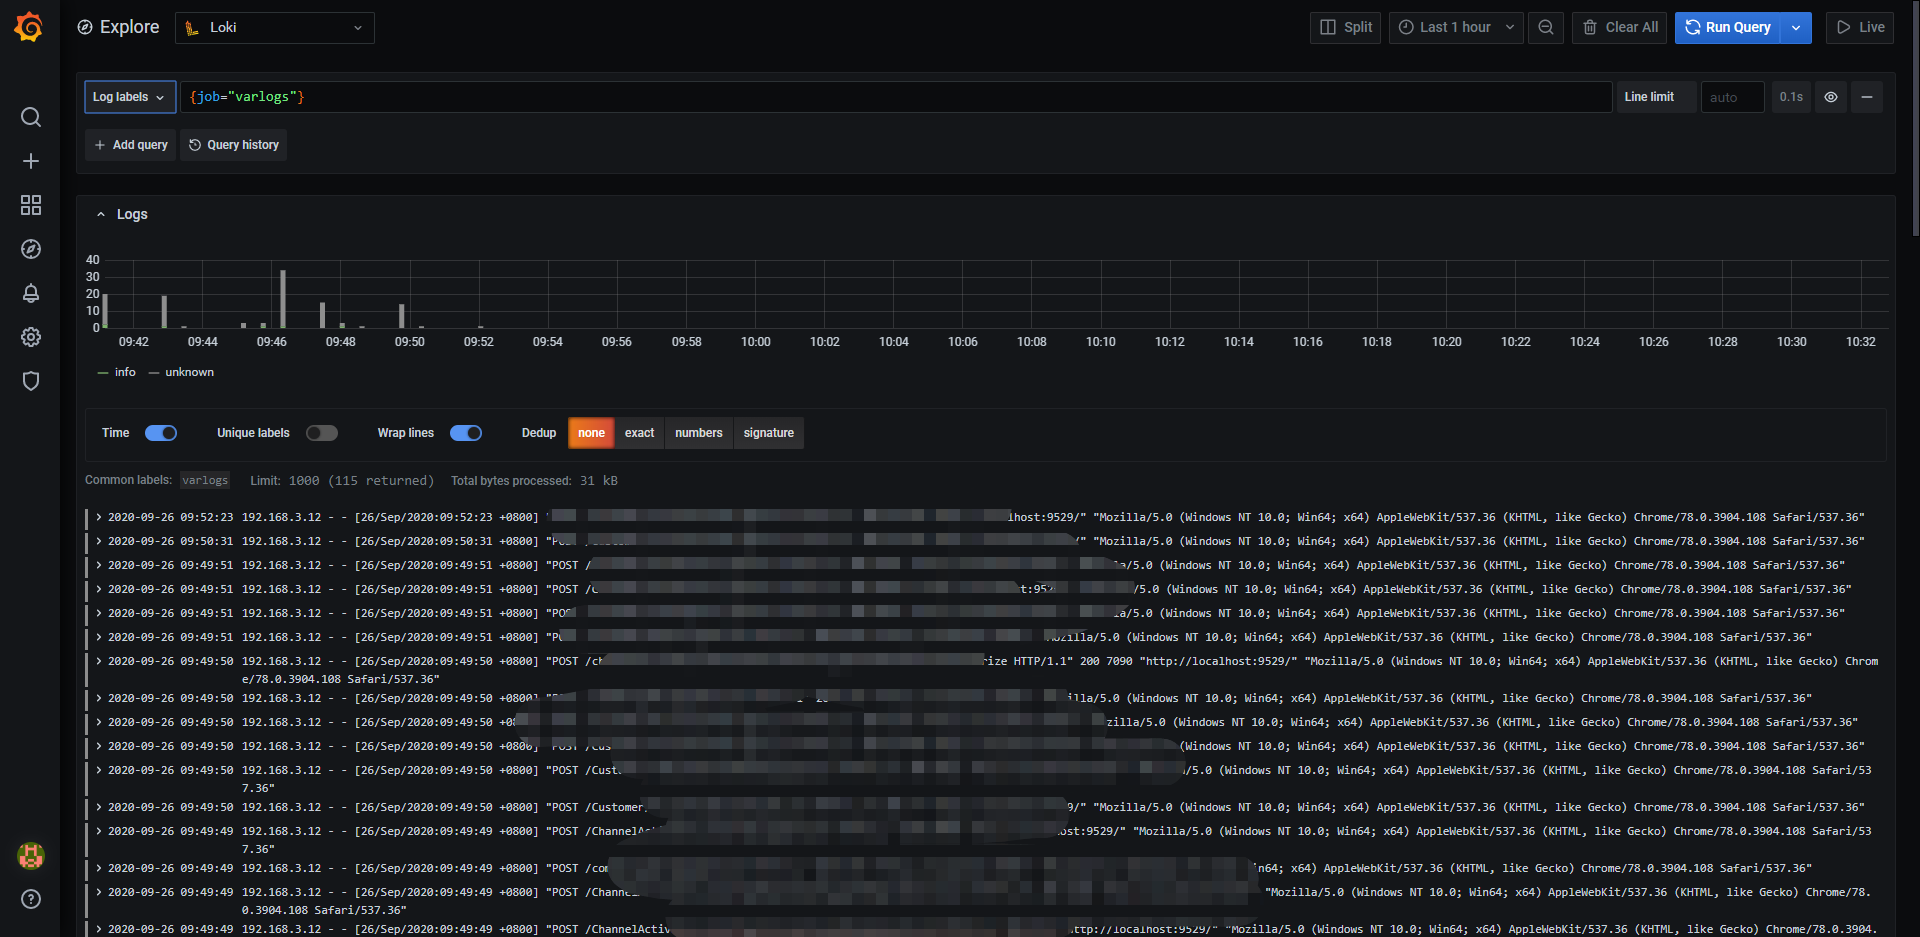
然后直接去查看explore

选择log label
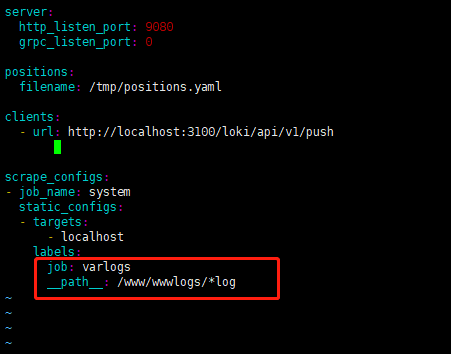
log label就是promtail-local-config.yaml配置文件里面的scraoe_configs里面的的labels
如果这里不出现的原因可能有2个:
1.grafana访问promtail的端口链接超时,目前没发现解决办法。
2.__path__路径错了。可以通过访问localhost:9080 查看
localhost:9080页面
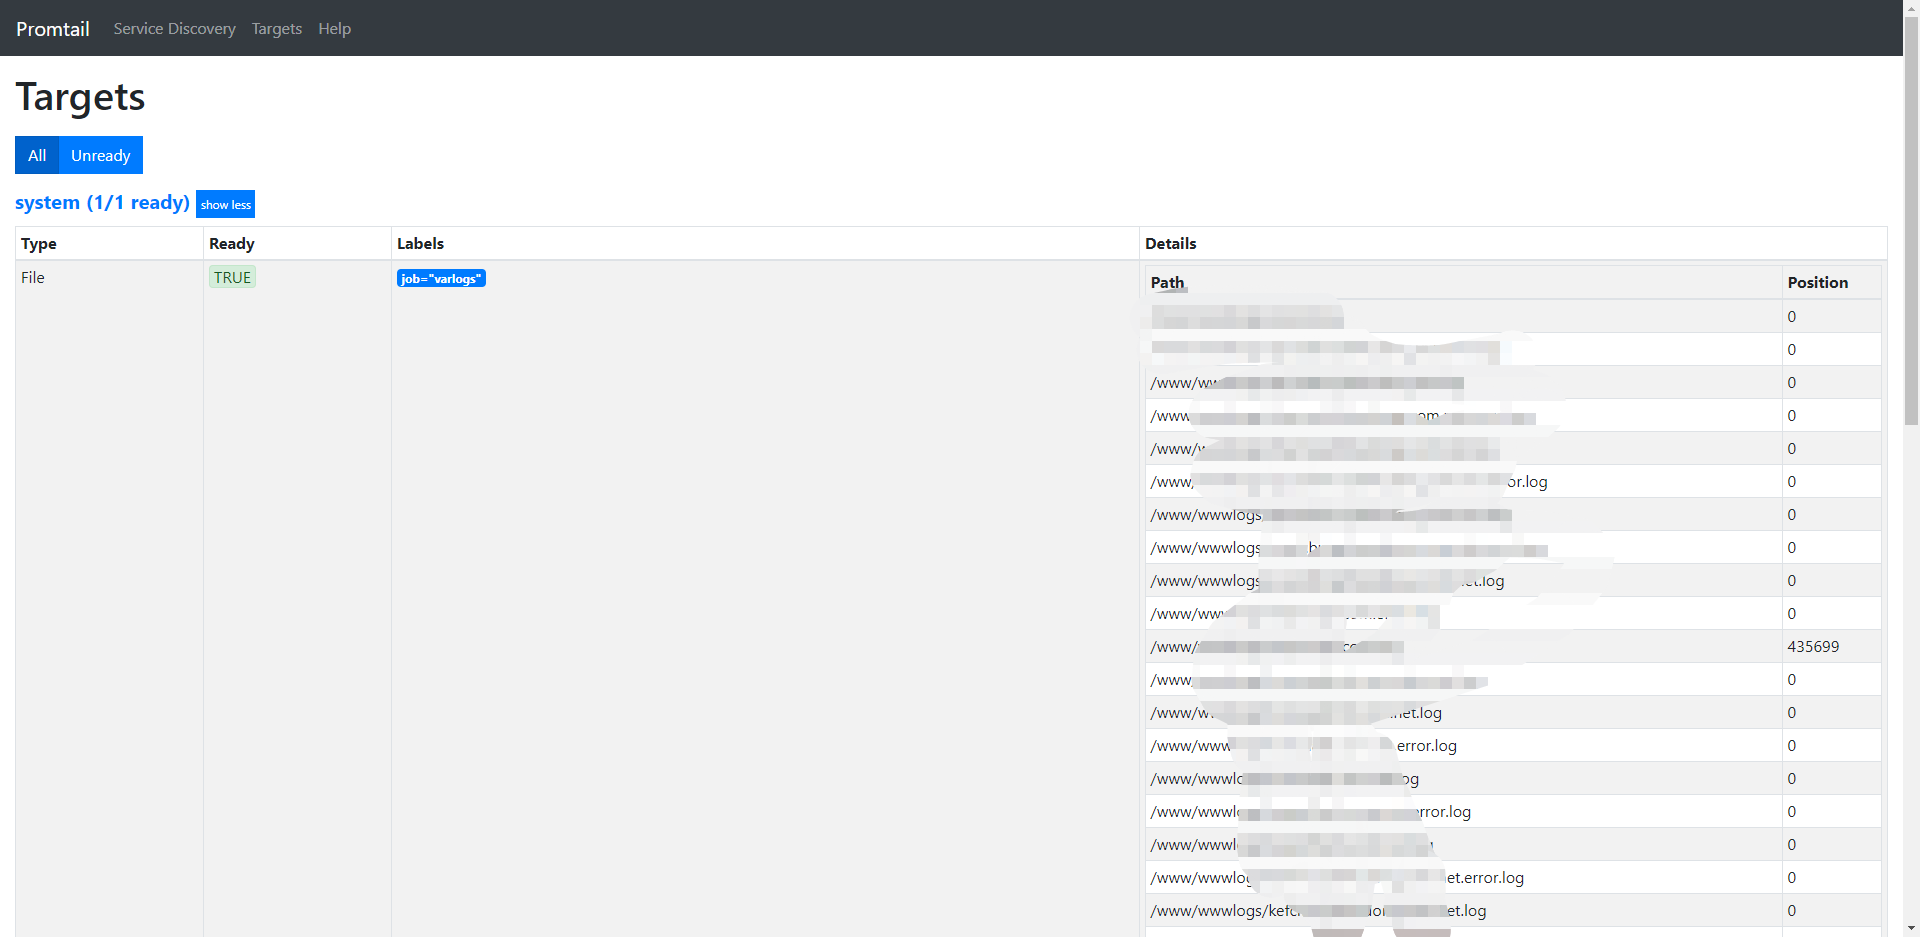
如果配置成如下。就表示成功了
相对来说比ELK简单很多。下载三个文件,修改下配置就可以直接跑通。个人感觉loki的重点应该是分布式日志的获取
loki是日志处理
promtail是收集日志
grafana是UI页面