<div id="barEcharts" style=" 500px;height:400px;"></div>
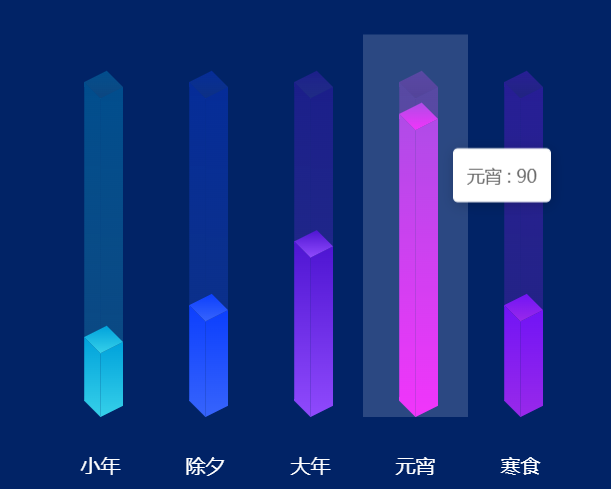
init() {
  this.charts = echarts.init(document.getElementById('barEcharts'));
  // 绘制左侧面
  const CubeLeft = echarts.graphic.extendShape({
    shape: {
      x: 0,
      y: 0
    },
    buildPath: function (ctx, shape) {
      // 会canvas的应该都能看得懂,shape是从custom传入的
      const xAxisPoint = shape.xAxisPoint
      const c0 = [shape.x, shape.y]
      const c1 = [shape.x - 13, shape.y - 13]
      const c2 = [xAxisPoint[0] - 13, xAxisPoint[1] - 13]
      const c3 = [xAxisPoint[0], xAxisPoint[1]]
      ctx.moveTo(c0[0], c0[1]).lineTo(c1[0], c1[1]).lineTo(c2[0], c2[1]).lineTo(c3[0], c3[1]).closePath()
    }
  })
  // 绘制右侧面
  const CubeRight = echarts.graphic.extendShape({
    shape: {
      x: 0,
      y: 0
    },
    buildPath: function (ctx, shape) {
      const xAxisPoint = shape.xAxisPoint
      const c1 = [shape.x, shape.y]
      const c2 = [xAxisPoint[0], xAxisPoint[1]]
      const c3 = [xAxisPoint[0] + 18, xAxisPoint[1] - 9]
      const c4 = [shape.x + 18, shape.y - 9]
      ctx.moveTo(c1[0], c1[1]).lineTo(c2[0], c2[1]).lineTo(c3[0], c3[1]).lineTo(c4[0], c4[1]).closePath()
    }
  })
  // 绘制顶面
  const CubeTop = echarts.graphic.extendShape({
    shape: {
      x: 0,
      y: 0
    },
    buildPath: function (ctx, shape) {
      const c1 = [shape.x, shape.y]
      const c2 = [shape.x + 18, shape.y - 9]
      const c3 = [shape.x + 5, shape.y - 22]
      const c4 = [shape.x - 13, shape.y - 13]
      ctx.moveTo(c1[0], c1[1]).lineTo(c2[0], c2[1]).lineTo(c3[0], c3[1]).lineTo(c4[0], c4[1]).closePath()
    }
  })
  // 注册三个面图形
  echarts.graphic.registerShape('CubeLeft', CubeLeft)
  echarts.graphic.registerShape('CubeRight', CubeRight)
  echarts.graphic.registerShape('CubeTop', CubeTop)

  const MAX = [100, 100, 100, 100, 100]
  const VALUE = [20, 30, 50, 90, 30]
  let option = {
    backgroundColor: "#012366",

    tooltip: {
      trigger: 'axis',
      axisPointer: {
        type: 'shadow'
      },
      formatter: function (params, ticket, callback) {
        const item = params[1]
        return item.name + ' : ' + item.value;
      }
    },
    grid: {
      left: 40,
      right: 40,
      bottom: 40,
      top: 30,
      containLabel: true
    },
    xAxis: {
      type: 'category',
      data: ['小年', '除夕', '大年', '元宵', '寒食'],
      axisLine: {
        show: false,
        lineStyle: {
          color: 'white'
        }
      },
      offset: 25,
      axisTick: {
        show: false,
        length: 9,
        alignWithLabel: true,
        lineStyle: {
          color: '#7DFFFD'
        }
      },
      axisLabel: {
        show: true,
        fontSize: 16
      },
    },
    yAxis: {
      type: 'value',
      axisLine: {
        show: false,
        lineStyle: {
          color: 'white'
        }
      },
      splitLine: {
        show: false
      },
      axisTick: {
        show: false
      },
      axisLabel: {
        show: false,
        fontSize: 16
      },
      boundaryGap: ['20%', '20%']
    },
    series: [{
      type: 'custom',
      renderItem: function (params, api) {
        const location = api.coord([api.value(0), api.value(1)])
        // 自定义每根柱子的颜色(总高度,透明柱子)
        let color1 = '',
            color2 = '';
        if(api.value()===0){
          color1 = '#00A2DB55';
          color2 = '#36D0E933';
        } else if(api.value()===1){
          color1 = '#0C3FFD55';
          color2 = '#3764FC33';
        } else if(api.value()===2){
          color1 = '#4E15D255';
          color2 = '#904AFD33';
        } else if(api.value()===3){
          color1 = '#A727E555';
          color2 = '#F90BFD33';
        } else if(api.value()===4){
          color1 = '#7114F555';
          color2 = '#9929EA33';
        }
        var color = new echarts.graphic.LinearGradient(0, 0, 0, 1, [
          { offset: 0, color: color1 },
          { offset: 1, color: color2 }
        ])
        return {
          type: 'group',
          children: [{
            type: 'CubeLeft',
            shape: {
              api,
              x: location[0],
              y: location[1],
              xAxisPoint: api.coord([api.value(0), 0])
            },
            style: {
              fill: color
            }
          }, {
            type: 'CubeRight',
            shape: {
              api,
              x: location[0],
              y: location[1],
              xAxisPoint: api.coord([api.value(0), 0])
            },
            style: {
              fill: color
            }
          }, {
            type: 'CubeTop',
            shape: {
              api,
              x: location[0],
              y: location[1],
              xAxisPoint: api.coord([api.value(0), 0])
            },
            style: {
              fill: color
            }
          }]
        }
      },
      data: MAX
    }, {
      type: 'custom',
      renderItem: (params, api) => {
        const location = api.coord([api.value(0), api.value(1)])
        // 自定义每根柱子的颜色(数据柱子,实体柱子)
        let color1 = '',
            color2 = '';
        if(api.value()===0){
          color1 = '#00A2DB';
          color2 = '#36D0E9';
        } else if(api.value()===1){
          color1 = '#0C3FFD';
          color2 = '#3764FC';
        } else if(api.value()===2){
          color1 = '#4E15D2';
          color2 = '#904AFD';
        } else if(api.value()===3){
          color1 = '#A727E5';
          color2 = '#F90BFD';
        } else if(api.value()===4){
          color1 = '#7114F5';
          color2 = '#9929EA';
        }
        var color = new echarts.graphic.LinearGradient(0, 0, 0, 1, [
          { offset: 0, color: color1 },
          { offset: 1, color: color2 }
        ])
        return {
          type: 'group',
          children: [{
            type: 'CubeLeft',
            shape: {
              api,
              xValue: api.value(0),
              yValue: api.value(1),
              x: location[0],
              y: location[1],
              xAxisPoint: api.coord([api.value(0), 0])
            },
            style: {
              fill: color
            }
          }, {
            type: 'CubeRight',
            shape: {
              api,
              xValue: api.value(0),
              yValue: api.value(1),
              x: location[0],
              y: location[1],
              xAxisPoint: api.coord([api.value(0), 0])
            },
            style: {
              fill: color
            }
          }, {
            type: 'CubeTop',
            shape: {
              api,
              xValue: api.value(0),
              yValue: api.value(1),
              x: location[0],
              y: location[1],
              xAxisPoint: api.coord([api.value(0), 0])
            },
            style: {
              fill: color
            }
          }]
        }
      },
      data: VALUE
    },
    // 如需单独设置图表的一些样式,可单独列一个对象,下列对象只是修改(总高度透明柱子)的对象
    // 如需设置(数据柱子)的参数,需再创建一个对象
    {
      type: 'bar',
      label: {
        normal: {
          show: false,
          position: 'top',
          fontSize: 16,
          color: '#fff',
          offset: [2, -25]
        }
      },
      itemStyle: {
        color: 'transparent'
      },
      tooltip: {

      },
      data: MAX
    }]
  }
  // 使用刚指定的配置项和数据显示图表。
  this.charts.setOption(option);
}
PS: 代码来源于:https://www.makeapie.com/editor.html?c=xoqSlmiSRZ ,我对源码进行了部分处理