欢迎来到"bio生物信息"的世界
之前的推文GWAS: 曼哈顿图,QQ plot 图,膨胀系数( manhattan、Genomic Inflation Factor)写过如何用qqman包做曼哈顿图。
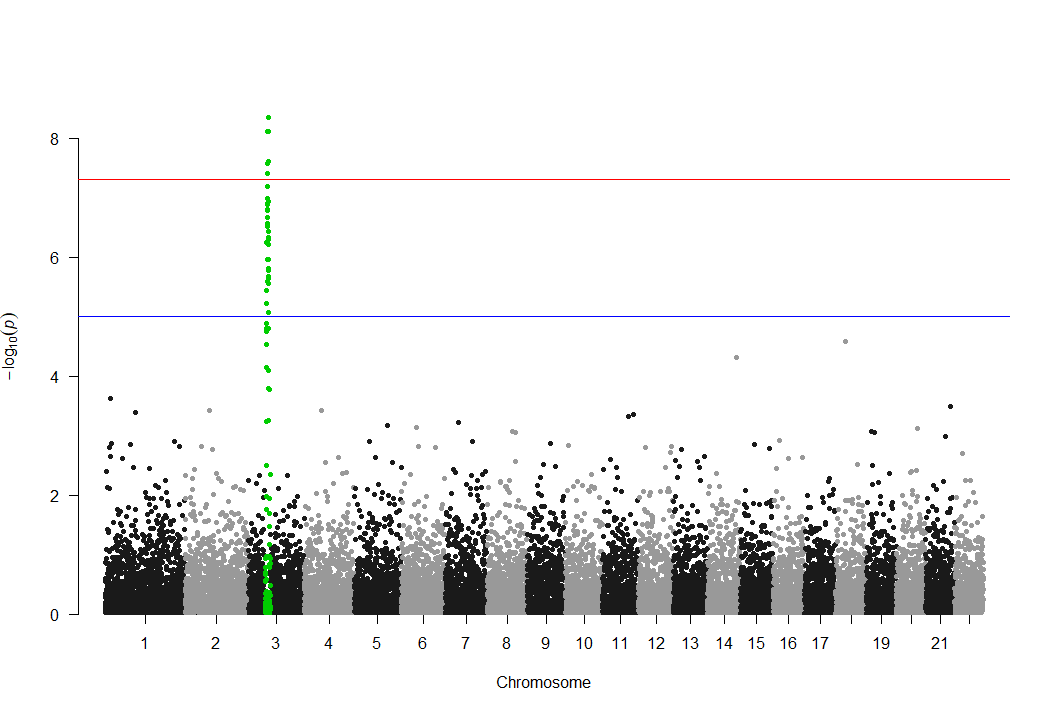
但众所周知(据我说知),这个包画图很丑,尤其想highlight显著位点时,屎一样的绿色让人一言难尽。
这话不是我说是,是下面这位小伙子说的

此外,该包还有一个明显缺点,只能highlight一个显著位点,如下所示:
很多时候,我们想组合多个不同表型的显著位点,并对不同的显著位点进行highlight时,用qqman包显然就实现不了。
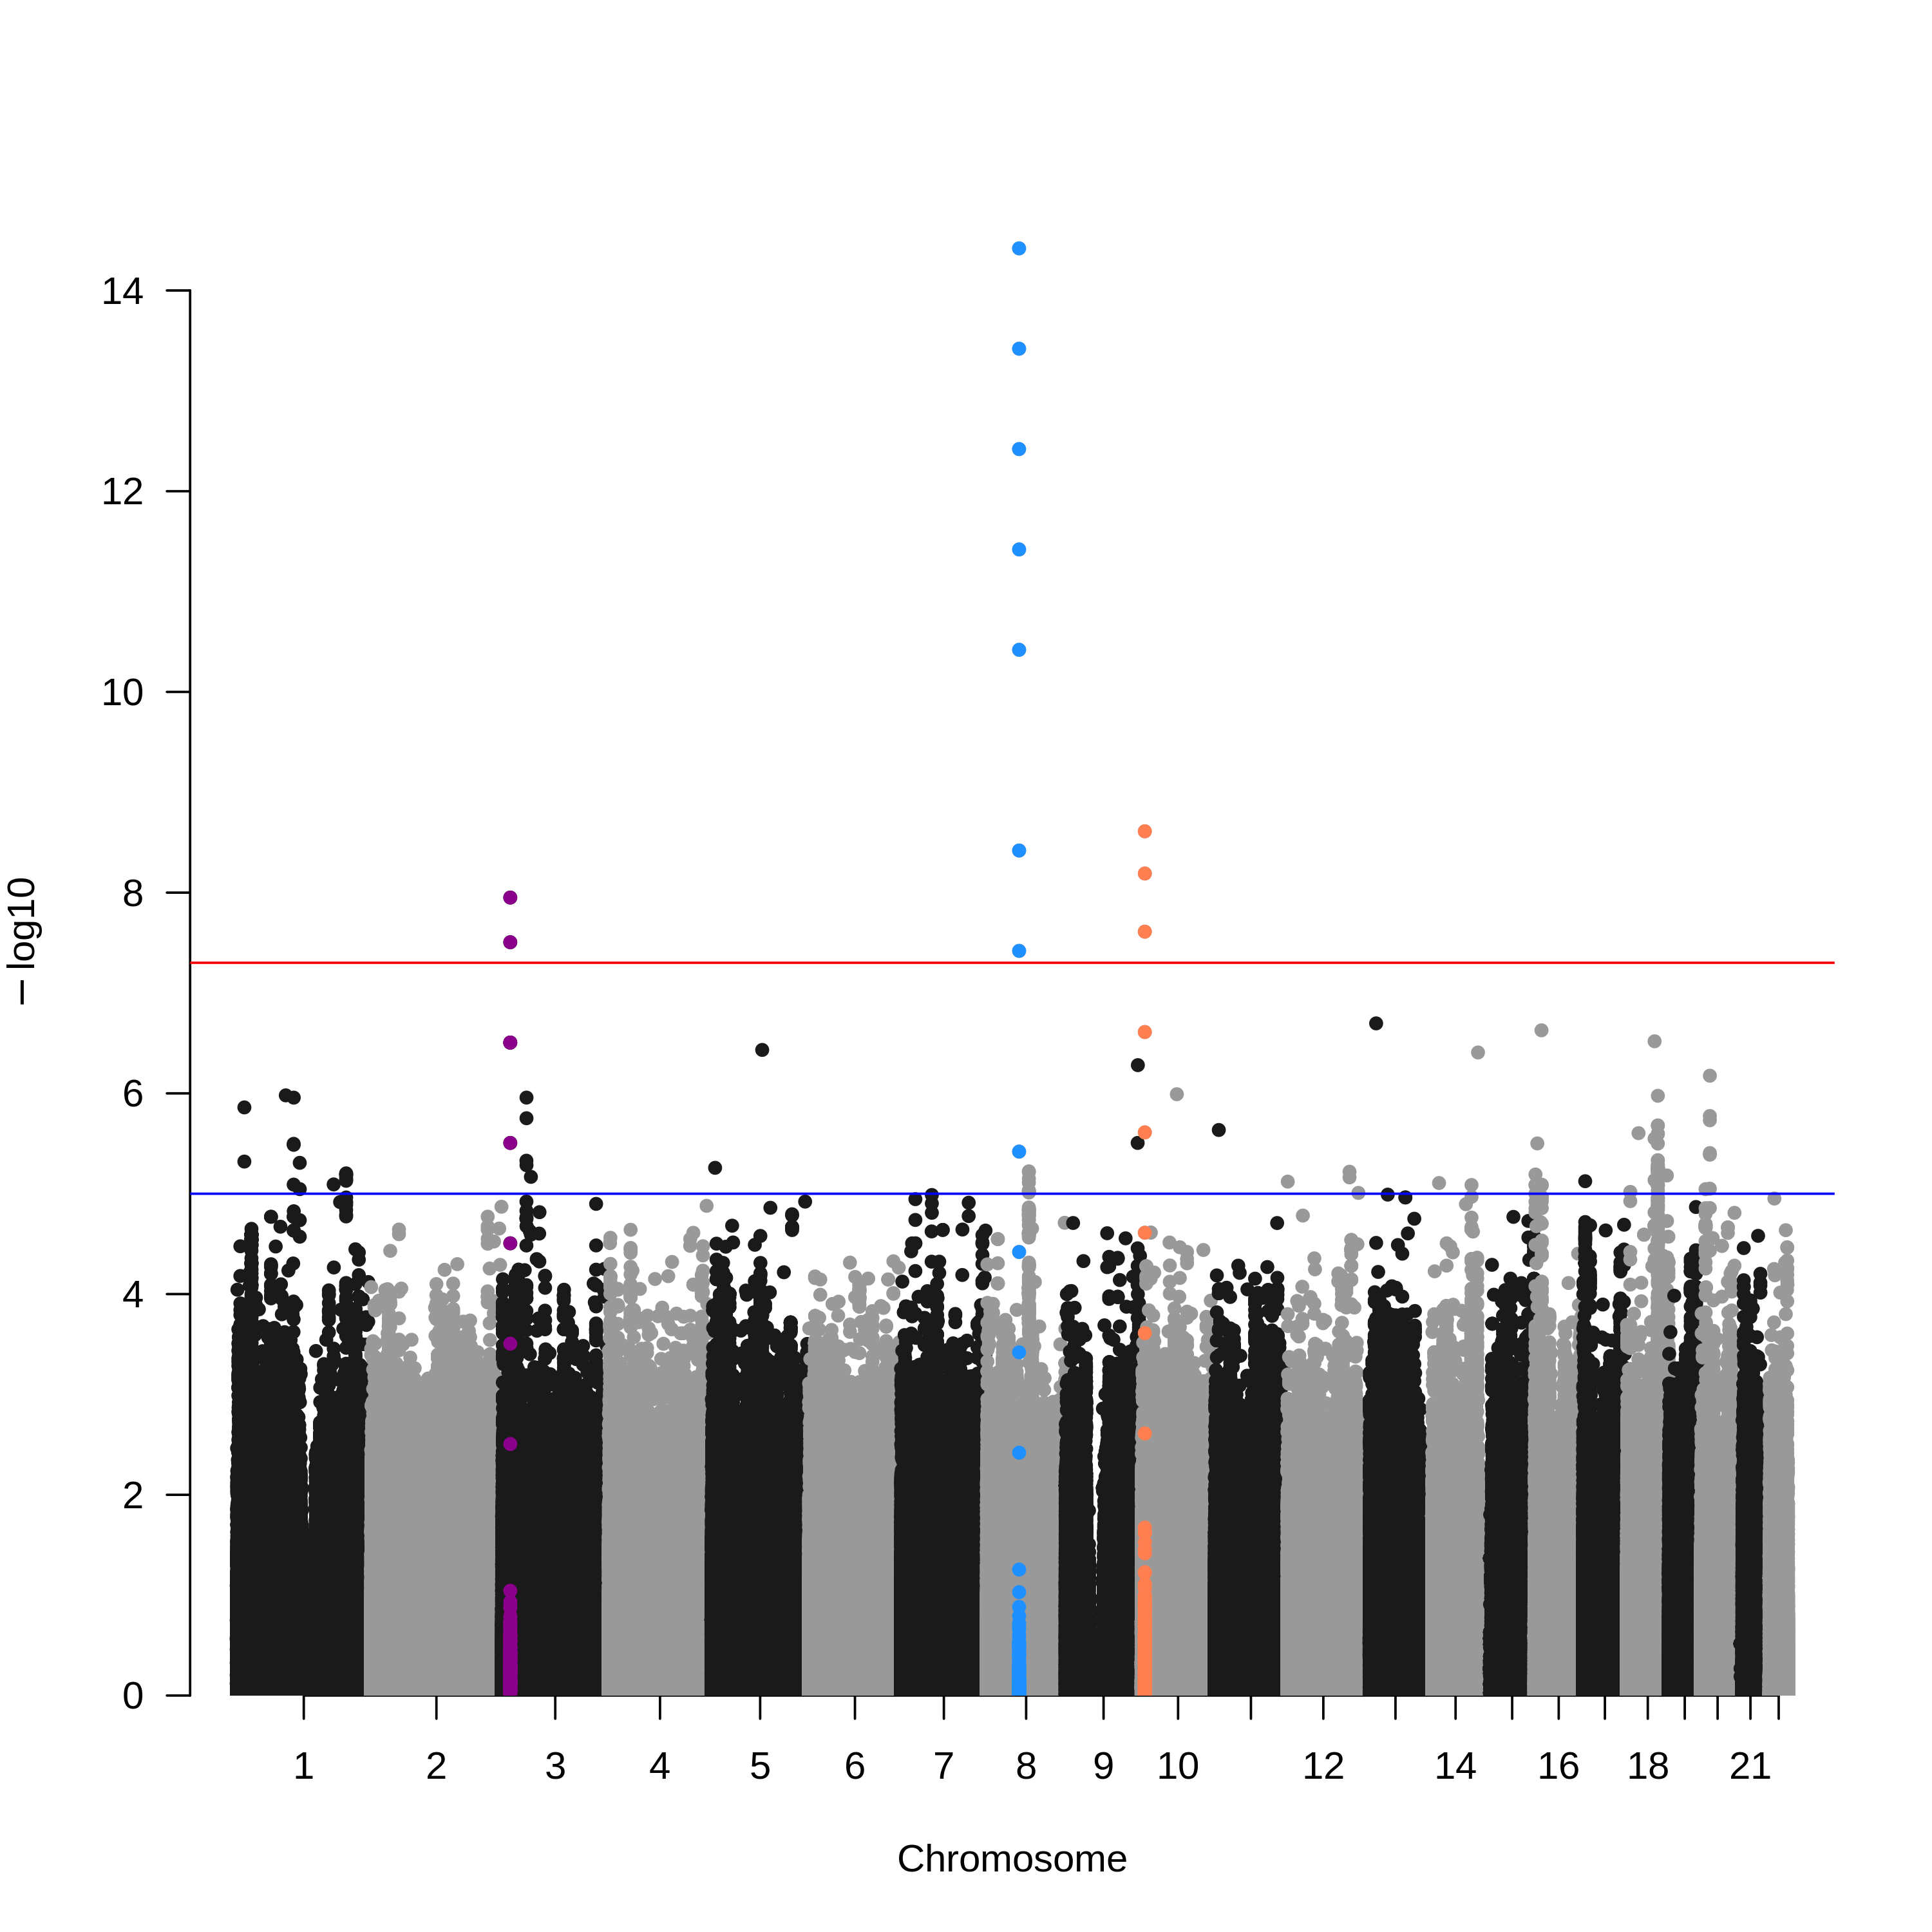
因此,今天的重点就是怎么在qqman的基础上highlight多个显著位点,并且用不同的颜色表示。
我们想实现的效果如下图所示:
接下来,讲重点。
如何用对曼哈顿图多个显著位点标志不同颜色。
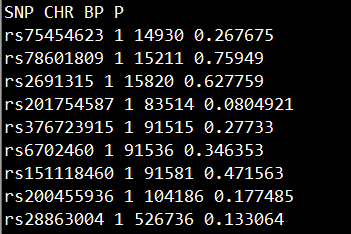
1 准备关联分析文件
准备包含SNP, CHR, BP, P的文件gwasResults,如下所示:
2 准备想要highlight的显著位点
想highlight多少个locus就准备多少个文件。
以这里为例,我想highlight三个显著locus,就准备三个文件。
每个文件的格式如下图所示:
set1文件:

set2文件:

set3文件:

3 画图
画图分两步走。
第一步:
完全复制如下代码到你的R中,不需要修改任何参数。
manhattan1<-function (x, chr = "CHR", bp = "BP", p = "P", snp = "SNP", col = c("gray10",
                                                                               "gray60"), chrlabs = NULL, suggestiveline = -log10(1e-05),
                      genomewideline = -log10(5e-08), highlight1 = NULL, highlight2 = NULL,highlight3 = NULL, logp = TRUE,
                      ...)
{
  CHR = BP = P = index = NULL
  if (!(chr %in% names(x)))
    stop(paste("Column", chr, "not found!"))
  if (!(bp %in% names(x)))
    stop(paste("Column", bp, "not found!"))
  if (!(p %in% names(x)))
    stop(paste("Column", p, "not found!"))
  if (!(snp %in% names(x)))
    warning(paste("No SNP column found. OK unless you're trying to highlight."))
  if (!is.numeric(x[[chr]]))
    stop(paste(chr, "column should be numeric. Do you have 'X', 'Y', 'MT', etc? If so change to numbers and try again."))
  if (!is.numeric(x[[bp]]))
    stop(paste(bp, "column should be numeric."))
  if (!is.numeric(x[[p]]))
    stop(paste(p, "column should be numeric."))
  d = data.frame(CHR = x[[chr]], BP = x[[bp]], P = x[[p]])
  if (!is.null(x[[snp]]))
    d = transform(d, SNP = x[[snp]])
  d <- subset(d, (is.numeric(CHR) & is.numeric(BP) & is.numeric(P)))
  d <- d[order(d$CHR, d$BP), ]
  if (logp) {
    d$logp <- -log10(d$P)
  }
  else {
    d$logp <- d$P
  }
  d$pos = NA
  d$index = NA
  ind = 0
  for (i in unique(d$CHR)) {
    ind = ind + 1
    d[d$CHR == i, ]$index = ind
  }
  nchr = length(unique(d$CHR))
  if (nchr == 1) {
    options(scipen = 999)
    d$pos = d$BP/1e+06
    ticks = floor(length(d$pos))/2 + 1
    xlabel = paste("Chromosome", unique(d$CHR), "position(Mb)")
    labs = ticks
  }
  else {
    lastbase = 0
    ticks = NULL
    for (i in unique(d$index)) {
      if (i == 1) {
        d[d$index == i, ]$pos = d[d$index == i, ]$BP
      }
      else {
        lastbase = lastbase + tail(subset(d, index ==
                                            i - 1)$BP, 1)
        d[d$index == i, ]$pos = d[d$index == i, ]$BP +
          lastbase
      }
      ticks = c(ticks, (min(d[d$CHR == i, ]$pos) + max(d[d$CHR ==
                                                           i, ]$pos))/2 + 1)
    }
    xlabel = "Chromosome"
    labs <- unique(d$CHR)
  }
  xmax = ceiling(max(d$pos) * 1.03)
  xmin = floor(max(d$pos) * -0.03)
  def_args <- list(xaxt = "n", bty = "n", xaxs = "i", yaxs = "i",
                   las = 1, pch = 20, xlim = c(xmin, xmax), ylim = c(0,
                                                                     ceiling(max(d$logp))), xlab = xlabel, ylab = expression(-log10))
  dotargs <- list(...)
  do.call("plot", c(NA, dotargs, def_args[!names(def_args) %in%
                                            names(dotargs)]))
  if (!is.null(chrlabs)) {
    if (is.character(chrlabs)) {
      if (length(chrlabs) == length(labs)) {
        labs <- chrlabs
      }
      else {
        warning("You're trying to specify chromosome labels but the number of labels != number of chromosomes.")
      }
    }
    else {
      warning("If you're trying to specify chromosome labels, chrlabs must be a character vector")
    }
  }
  if (nchr == 1) {
    axis(1, ...)
  }
  else {
    axis(1, at = ticks, labels = labs, ...)
  }
  col = rep(col, max(d$CHR))
  if (nchr == 1) {
    with(d, points(pos, logp, pch = 20, col = col[1], ...))
  }
  else {
    icol = 1
    for (i in unique(d$index)) {
      with(d[d$index == unique(d$index)[i], ], points(pos,
                                                      logp, col = col[icol], pch = 20, ...))
      icol = icol + 1
    }
  }
  if (suggestiveline)
    abline(h = suggestiveline, col = "blue")
  if (genomewideline)
    abline(h = genomewideline, col = "red")
  if (!is.null(highlight1)) {
    if (any(!(highlight1 %in% d$SNP)))
      warning("You're trying to highlight1 SNPs that don't exist in your results.")
    d.highlight1 = d[which(d$SNP %in% highlight1), ]
    with(d.highlight1, points(pos, logp, col = "darkmagenta", pch = 20,
                              ...))
  }
  if (!is.null(highlight2)) {
    if (any(!(highlight2 %in% d$SNP)))
      warning("You're trying to highlight2 SNPs that don't exist in your results.")
    d.highlight2 = d[which(d$SNP %in% highlight2), ]
    with(d.highlight2, points(pos, logp, col = "dodgerblue", pch = 20,
                              ...))
  }
  if (!is.null(highlight3)) {
    if (any(!(highlight3 %in% d$SNP)))
      warning("You're trying to highlight3 SNPs that don't exist in your results.")
    d.highlight3 = d[which(d$SNP %in% highlight3), ]
    with(d.highlight3, points(pos, logp, col = "coral", pch = 20,
                              ...))
  }
}
第二步:
第一步复制完以后,输入如下代码:
manhattan1(sw, highlight1=set1, highlight2=set2,highlight3=set3)
最后,坐等收图。
这里解释一下,如果你想highlight四个locus的话,只需要在第一步的末尾处新增加:
if (!is.null(highlight4)) {
    if (any(!(highlight4 %in% d$SNP)))
      warning("You're trying to highlight4 SNPs that don't exist in your results.")
    d.highlight4 = d[which(d$SNP %in% highlight4), ]
    with(d.highlight4, points(pos, logp, col = "coral", pch = 20,
                              ...))
  }
画图时改成manhattan1(sw, highlight1=set1, highlight2=set2,highlight3=set3,highlight4=set4)
其他的以此类推。
此文章感谢evermane修改的代码。感兴趣的请看链接的讨论:https://github.com/stephenturner/qqman/issues/38