原文地址:https://blog.modeanalytics.com/date-trunc-sql-timestamp-function-count-on/
In a world of ever expanding data streams, we rely on timestamps to organize data down to the millisecond. But this level of detail can be distracting.
Suppose you want to explore trends in user signups. You’ll need to aggregate signup event data by the time each event occurred. Event timestamps can help, but you probably don’t need all the information they contain. Maybe you’re interested in signups by year, month, or day but signups by hour, minute, or millisecond would be overkill.
That’s where the DATE_TRUNC() function comes in handy. You can use it to round a timestamp to the interval you need.
Timestamps: look how ugly they are
Timestamps are long and contain a ton of info:

Zulu? Yep.
DATE_TRUNC() to the rescue
To remove the unwanted detail of a timestamp, feed it into the DATE_TRUNC(‘[interval]’, time_column) function. time_column is the database column that contains the timestamp you’d like to round, and ‘[interval]’dictates your desired precision level. You can round off a timestamp to one of these units of time:
- microsecond
- millisecond
- second
- minute
- hour
- day
- week
- month
- quarter
- year
- decade
- century
- millenium
If the above timestamp were rounded down to 'day', the result is:
2015-10-06T00:00:00.000Z
If it were rounded down to 'minute', it would look like this:
2015-10-06T11:54:00.000Z
Likewise, ‘second’ rounds down to the nearest second, ‘hour’ down to the nearest hour, and so on. ‘week’ rounds down to that Monday’s date.
Creating a time-series with truncated timestamps
DATE_TRUNC() is particularly useful when you want to aggregate information over an interval of time. Using one of the mock datasets from Mode’s SQL School, let’s explore time-related trends in user signups as an example use case.
Let’s start with this query:
SELECT occurred_at,
       user_id
  FROM benn.fake_fact_events
 WHERE event_name = 'complete_signup'
   AND occurred_at >= '2014-03-10'
   AND occurred_at <= '2014-05-26'
 ORDER BY 1 DESC
Which results in this table:

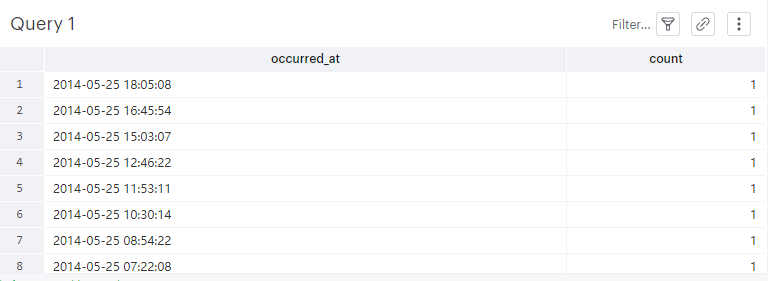
As you might guess, these data don’t aggregate in a helpful way. Here’s what it looks like when you try to group signups together by timestamp:
SELECT occurred_at,
       COUNT(user_id)
  FROM benn.fake_fact_events
 WHERE event_name = 'complete_signup'
   AND occurred_at >= '2014-03-10'
   AND occurred_at <= '2014-05-26'
 GROUP BY 1
 ORDER BY 1 DESC
Even though these timestamps don’t contain millisecond detail, there’s still too much information to shed light on any meaningful trends. Let’s instead roll up the occurred_at events by the day they occurred:
DATE_TRUNC(‘day’, occurred_at)
Here’s the full query:
SELECT DATE_TRUNC('day', occurred_at) AS day,
       user_id
  FROM benn.fake_fact_events
 WHERE event_name = 'complete_signup'
   AND occurred_at >= '2014-03-10'
   AND occurred_at <= '2014-05-26'
 ORDER BY 1 DESC
And the results:

Using the truncated timestamps as keys and aggregating over rows with the same key, you can pool values by time interval. For example, you can count the number of signups that occurred on each day:
SELECT DATE_TRUNC('day', occurred_at) AS day,
       COUNT(user_id)
  FROM benn.fake_fact_events
 WHERE event_name = 'complete_signup'
   AND occurred_at >= '2014-03-10'
   AND occurred_at <= '2014-05-26'
 GROUP BY 1
 ORDER BY 1 DESC
These results can be visualized as a daily time series:
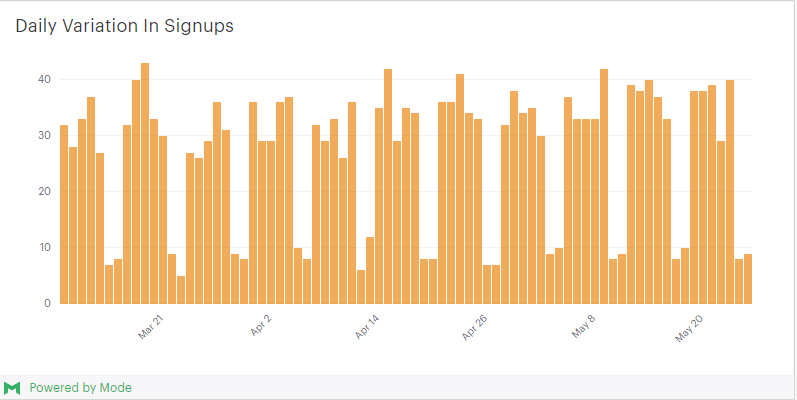
It quickly becomes clear that signups dip every weekend. While this highlights the weekly cycle, it’s still hard to pin down the pattern week over week. Have signups increased over the last few months? Have there been any noticeable dips?
To get at this, we simply switch the level of aggregation from ‘day’ to ‘week’:
SELECT DATE_TRUNC('week', occurred_at) AS week,
       COUNT(user_id)
  FROM benn.fake_fact_events
 WHERE event_name = 'complete_signup'
   AND occurred_at >= '2014-03-10'
   AND occurred_at <= '2014-05-26'
 GROUP BY 1
 ORDER BY 1 DESC
We can now visualize the data as a weekly time series:

With the noise of the in-week fluctuations removed, we can now see that signups have held mostly stable, with a slight dip in late March that has since rebounded.
As you can see, the DATE_TRUNC() function can be tremendously useful for aggregating time-based data. For easy-to-access reference, we’ve complied the key details of this SQL function as our latest “datapointer!”
