一、
网址: https://www.cnblogs.com/ldlx-mars/p/9242250.html
点击: 无区域显示的中国地图
下载文件: 必须引入china.js
网址: https://www.cnblogs.com/xianwen/p/6045454.html
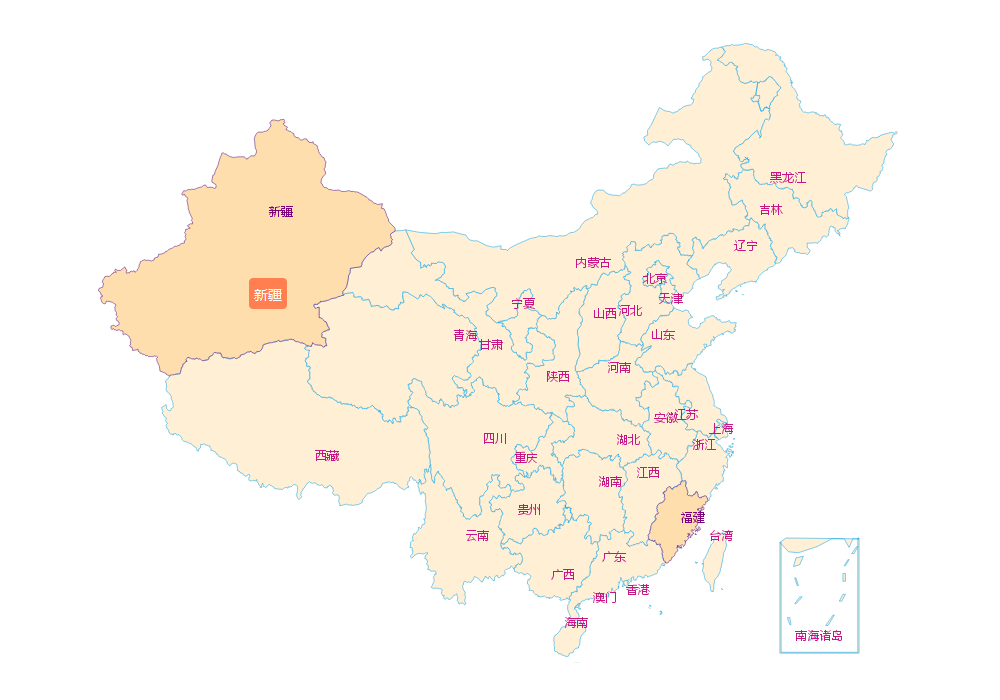
点击: 高亮颜色中国地图(有区域显示)
下载文件: 必须引入china.js
安装:npm install echart --saver
组件必须引入:
import echarts from 'echarts'
import '../../node_modules/echarts/map/js/china.js'
二、代码示例
<template>
<div id="chart_example"></div>
</template>
<style lang="stylus" scoped>
#chart_example {
50%;
height: 500px;
border: 1px solid red;
margin: 0 auto;
}
</style>
<script>
import $ from 'jquery'
import echarts from 'echarts'
import '../../node_modules/echarts/map/js/china.js'
export default {
data(){
return{
}
},
methods:{
},
mounted(){
//无区域的地图显示
let myChart = echarts.init(document.getElementById('chart_example'));
let option = {
series: [{
type: 'map',
// // mapType: 'china'// mapType或者map都可以
map: 'china',
}]
};
myChart.setOption(option);
//无区域的地图显示//有区域的地图显示
var myChart = echarts.init(document.getElementById('chart_example'));
var option = {
tooltip: {
// show: false //不显示提示标签
formatter: '{b}', //提示标签格式
backgroundColor:"#ff7f50",//提示标签背景颜色
textStyle:{color:"#fff"} //提示标签字体颜色
},
series: [{
type: 'map',
mapType: 'china',
label: {
normal: {
show: true,//显示省份标签
textStyle:{color:"#c71585"}//省份标签字体颜色
},
emphasis: {//对应的鼠标悬浮效果
show: true,
textStyle:{color:"#800080"}
}
},
itemStyle: {
normal: {
borderWidth: .5,//区域边框宽度
borderColor: '#009fe8',//区域边框颜色
areaColor:"#ffefd5",//区域颜色
},
emphasis: {
borderWidth: .5,
borderColor: '#4b0082',
areaColor:"#ffdead",
}
},
data:[
{name:'福建', selected:true}//福建为选中状态
]
}],
};
myChart.setOption(option);
myChart.on('mouseover', function (params) {
var dataIndex = params.dataIndex;
console.log(params);
});
}
}
</script>
三、效果图

四、修改省份标签位置:
打开china.js文件,修改"properties":{"cp":[X坐标,Y坐标],...}
