之前研究过研究过百度地图配合echarts实现热力地图和大量标注点加载,有兴趣可查看博客https://www.cnblogs.com/class1/p/13691867.html。结果效果不是太理想,进而转战高德地图。
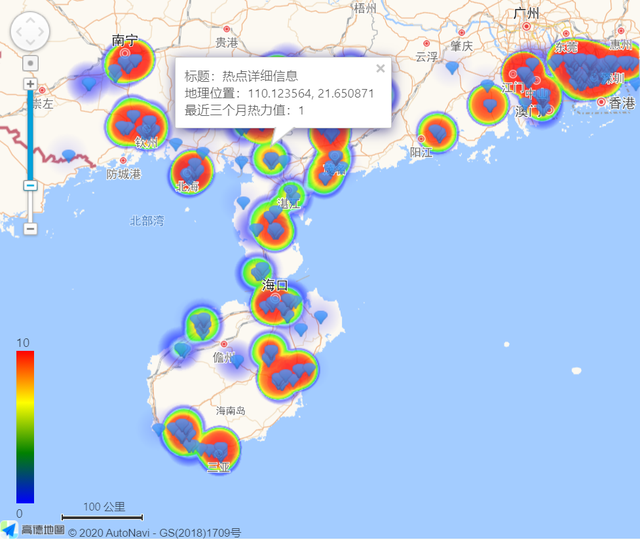
最终效果图先展示一波。
图上效果图的实现主要有五点:
一,高德地图的引入。
引入地图,和百度地图一样,还是要申请自己使用的key值,网上讲解很多,这里不再细述。有了key值以后,在全局的入口html文件中引入高德地图,我使用的是antd pro框架,入口文件是document.ejs。如果不想申请key值,直接复制粘贴下面的就可以行。
<script type="text/javascript" src="http://webapi.amap.com/maps?v=1.3&key=4611f58483d79aa58bf6d2b508078f9c&plugin=AMap.Autocomplete,AMap.PlaceSearch"></script>然后直接在项目里创建页面文件,写你的地图就完了,非常方便。这里我创建的地图文件命名为guidemap.js.
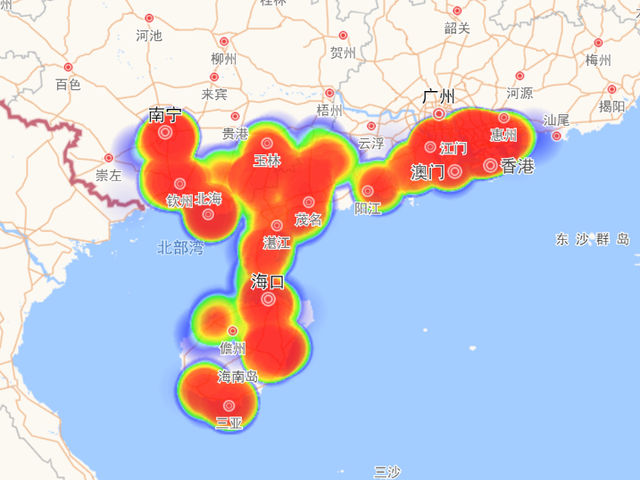
二,热力地图的实现。
关键部分代码:
// 创建地图,gaoDe为地图容器标签的id名
const map = new AMap.Map('gaoDe', {
      resizeEnable: true,   // 允许缩放地图
      center: [108.5, 34.3],  // 地图中心点经纬度
      zoom: 4   // 地图的等级,范围是3~18级
    });

    let heatmap;
    map.plugin(["AMap.Heatmap"], function () {
      // 初始化heatmap对象
      heatmap = new AMap.Heatmap(map, {
        radius: 25, // 给定半径
        opacity: [0, 0.8],
        gradient:{    // 热力值的颜色设置,范围是0-1,可以分段设置颜色
            0.5: 'blue',
            0.65: 'rgb(117,211,248)',
            0.7: 'rgb(0, 255, 0)',
            0.9: '#ffea00',
            1.0: 'red'
        }
      });
      heatmap.setDataSet({
        data: gaoData,  // heatmapData 热力地图的数据,这里的数据格式 [ {"lng": 116.191031,	"lat": 39.988585,	"count": 10},{...}]
        max: 10   // 热力最大范围值
      })
    });
效果图如下:
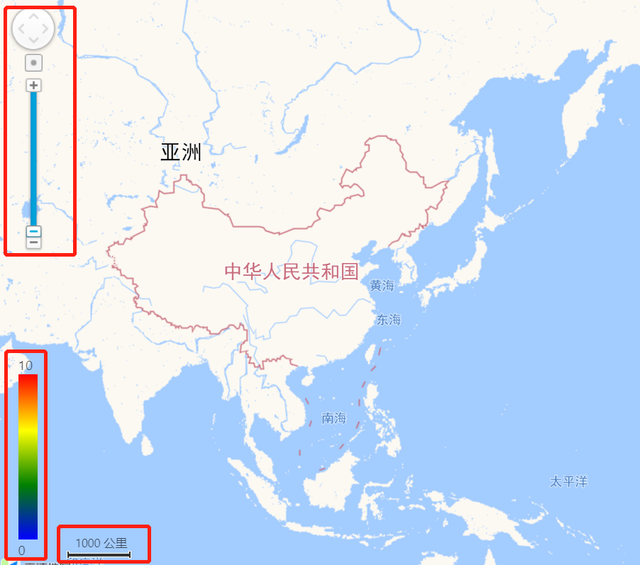
三,控件的添加。
关键部分代码:
  const scale = new AMap.Scale({
        visible: true,
        offset: new AMap.Pixel(70,20),   // 控件的偏移位置
      });
      map.addControl(scale);   // 添加比例尺控件
      map.addControl(new AMap.ToolBar());   // 添加缩放控件
因为是热力图,一般图上会有个热力标尺,但是高德地图没有,可以将高德地图引入echarts图表中,通过配置项加热力标尺(visualMap属性)。但是考虑到高德地图的功能比较完备,为了一个属性引入echarts,太大费周章。今天我决定手写个热力标尺:
<div
  style={{
      height:200,
       30 }}
   >
          10
          <div
            style={{
              20,
              height: 170,
              background: `linear-gradient(to top,blue,green 33%, yellow 66%, red)`,  // css写渐变色,这里是重点
            }}
          />
          0
    </div>
这个是在react项目里写的html,css样式这么写没问题的。
看下添加的控件效果:这个手写的热力标尺毫无违和感是不是。
四,海量点标记的添加。
// 海量点标记
    const mass = new AMap.MassMarks(massData, {
      opacity: 0.8,
      zIndex: 111,
      cursor: 'pointer',
      style: {
        url: 'https://webapi.amap.com/theme/v1.3/markers/n/mark_b.png',   // 点标注用的图片,可自定义
        anchor: new AMap.Pixel(6, 6),   // 位置偏移
        size: new AMap.Size(15, 15)   // 标注的大小
      }
    });

  mass.setMap(map);
此时就是页面标注点和热力图结合了,但是标注点还没有添加信息窗,点击是没有效果的。如果标注点不是太多,也可以不用海量点,直接创建mark,每一个依次添加就行
 const allLength=gaoData.length;    // 获取标注点的个数
     for(let i = 0; i < allLength; i += 1){    // 把每个点都添加在地图上
     const marker = new AMap.Marker({
        position: [gaoData[i].lng, gaoData[i].lat],
      map:map
       });
     }
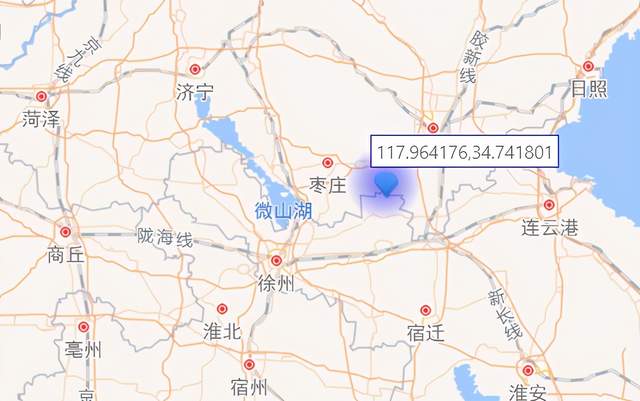
五,点标记的信息窗的添加。
点标记应该和上面的四合起来用的。如果是海量点,加信息窗如下:
const mass = new AMap.MassMarks(massData, {
      opacity: 0.8,
      zIndex: 111,
      cursor: 'pointer',
      style: {
        url: 'https://webapi.amap.com/theme/v1.3/markers/n/mark_b.png',
        anchor: new AMap.Pixel(6, 6),
        size: new AMap.Size(15, 15)
      }
    });

   //  这部分是label标签,使用label就是这样写的,使用这部分就要注释掉下面信息窗的代码
    // var marker = new AMap.Marker({content: ' ', map: map});
    // mass.on('mouseover', function (e) {
    //   marker.setPosition(e.data.lnglat);
    //   marker.setLabel({content: e.data.lnglat})
    // });


    const infoWindow = new AMap.InfoWindow({offset: new AMap.Pixel(0, -10)});
    mass.on('click', function (e) {
      infoWindow.setContent(`<div>
      标题:热点详细信息
      <br/>地理位置:${e.data.lnglat.lng}, ${e.data.lnglat.lat}
      <br/>最近三个月热力值:${e.data.val}
    </div>`);
      infoWindow.open(map, e.data.lnglat);
    });

    mass.setMap(map);
这个是使用label标签的效果,鼠标放在mark标注上就展示当前点的地理位置坐标:
如果点数不多这里提供了两种写法:
 const allLength=gaoData.length;
    for(let i = 0; i < allLength; i += 1){
      const marker = new AMap.Marker({
        position: [gaoData[i].lng, gaoData[i].lat],
        map:map
      });

      const infoWindow = new AMap.InfoWindow({
        anchor: 'bottom-center',
        content:`<div><p>这是信息窗体!这是信息窗体!</p><p>${gaoData[i].lng}</p></div>` ,
      });
      // 鼠标点击marker弹出自定义的信息窗体
      marker.on('click', function () {
        infoWindow.open(map,[gaoData[i].lng, gaoData[i].lat])
      });
    }
 var infoWindow = new AMap.InfoWindow({offset: new AMap.Pixel(0, -30)});
    const allLength=gaoData.length;
    function markerClick(e) {
      infoWindow.setContent(e.target.content);
      infoWindow.open(map, e.target.getPosition());
    }
    for(let i = 0; i < allLength; i += 1){
      const marker = new AMap.Marker({
        position: [gaoData[i].lng, gaoData[i].lat],
        map:map
      });
      marker.content = '我是第' + (i + 1) + '个Marker';
      marker.on('click', markerClick);
    }
最后附上完整的代码// guidemap.js
import React, { Component,Fragment } from 'react';

const {AMap} = window;

class Guide extends Component {

  constructor(props) {
    super(props);
    this.state = {
      data: props.data,
    };
  }

  componentDidMount() {
      this.getCharts();
  }

  // eslint-disable-next-line no-unused-vars
  componentWillReceiveProps(nextProps, nextContext) {
    if (nextProps.data.length > 0) {
      this.setState({
        data: nextProps.data,
      });
      setTimeout(() => {
        this.getCharts();
      }, 500);
    }else{ this.setState({data:[]})}
  }

  getCharts = () => {
    const { data } = this.state;
    const gaoData=[];
    const massData=[];
    // eslint-disable-next-line array-callback-return
      data.map(item=>{
        gaoData.push({ lng:item.longitude, lat:item.latitude, count:item.number})
        massData.push({lnglat:[item.longitude,item.latitude],val:item.number})
      });
    console.log("高德地图",gaoData);
    const map = new AMap.Map('gaoDe', {
      resizeEnable: true,
      center: [108.5, 34.3],
      zoom: 4
    });

    let heatmap;
    map.plugin(["AMap.Heatmap","AMap.Scale",'AMap.ToolBar',], function () {
      // 初始化heatmap对象
      heatmap = new AMap.Heatmap(map, {
        radius: 25, // 给定半径
        opacity: [0, 0.8],
        gradient:{
            0.5: 'blue',
            0.65: 'rgb(117,211,248)',
            0.7: 'rgb(0, 255, 0)',
            0.9: '#ffea00',
            1.0: 'red'
        }
      });
      heatmap.setDataSet({
        data: gaoData,// heatmapData
        max: 10
      });
      const scale = new AMap.Scale({
        visible: true,
        offset: new AMap.Pixel(70,20),
      });
      map.addControl(scale);
      map.addControl(new AMap.ToolBar());
    });

  // 海量点标记
    const mass = new AMap.MassMarks(massData, {
      opacity: 0.8,
      zIndex: 111,
      cursor: 'pointer',
      style: {
        url: 'https://webapi.amap.com/theme/v1.3/markers/n/mark_b.png',
        anchor: new AMap.Pixel(6, 6),
        size: new AMap.Size(15, 15)
      }
    });

    // var marker = new AMap.Marker({content: ' ', map: map});
    // mass.on('mouseover', function (e) {
    //   marker.setPosition(e.data.lnglat);
    //   marker.setLabel({content: e.data.lnglat})
    // });

    const infoWindow = new AMap.InfoWindow({offset: new AMap.Pixel(0, -10)});
    mass.on('click', function (e) {
      infoWindow.setContent(`<div>
      标题:热点详细信息
      <br/>地理位置:${e.data.lnglat.lng}, ${e.data.lnglat.lat}
      <br/>最近三个月热力值:${e.data.val}
    </div>`);
      infoWindow.open(map, e.data.lnglat);
    });

    mass.setMap(map);
   // map.setFitView();// 自适应所有的点

    // 点不多,添加mark和信息窗(方案一)
    // const allLength=gaoData.length;
    // for(let i = 0; i < allLength; i += 1){
    //   const marker = new AMap.Marker({
    //     position: [gaoData[i].lng, gaoData[i].lat],
    //     map:map
    //   });
    //
    //   const infoWindow = new AMap.InfoWindow({
    //     anchor: 'bottom-center',
    //     content:`<div><p>这是信息窗体!这是信息窗体!</p><p>${gaoData[i].lng}</p></div>` ,
    //   });
    //   // 鼠标点击marker弹出自定义的信息窗体
    //   marker.on('click', function () {
    //     infoWindow.open(map,[gaoData[i].lng, gaoData[i].lat])
    //   });
    // }

       // 点不多,添加mark和信息窗(方案二)
    // var infoWindow = new AMap.InfoWindow({offset: new AMap.Pixel(0, -30)});
    // const allLength=gaoData.length;
    // function markerClick(e) {
    //   infoWindow.setContent(e.target.content);
    //   infoWindow.open(map, e.target.getPosition());
    // }
    // for(let i = 0; i < allLength; i += 1){
    //   const marker = new AMap.Marker({
    //     position: [gaoData[i].lng, gaoData[i].lat],
    //     map:map
    //   });
    //   marker.content = '我是第' + (i + 1) + '个Marker';
    //   marker.on('click', markerClick);
    // }
  };

  render(){
    return (
      <Fragment>
        <div id="gaoDe" style={{  '100%', height: 600 }}>
          {' '}
        </div>
        <div
          style={{
            height:200,
            30,
            position:"relative",
            left:20,
            top: -230,
        }}
        >
          10
          <div
            style={{
              20,
              height: 170,
              background: `linear-gradient(to top,blue,green 33%, yellow 66%, red)`,
            }}
          />
          0
        </div>
      </Fragment>

    );
  }
}

export default Guide;
然后在其他页面引入这个地图:
import Guidemap from './guidemap';  //引入自己写好的热力地图
const arry=[
  {longitude:120.328789,latitude:34.876575,number:10},
 {longitude:120.328789,latitude:34.876575,number:10},
];
<Guidemap data={arry} />   //直接在页面引入标签使用  arry的数据格式你可以有自己的格式,不过你的格式改了的话,guide.js参数使用也得自己改下。
文章转载请标明出处,谢谢配合。