一、用于数据分析、科学计算与可视化的扩展模块主要有:numpy、scipy、pandas、SymPy、matplotlib、Traits、TraitsUI、Chaco、TVTK、Mayavi、VPython、OpenCV。
1.numpy模块:科学计算包,支持N维数组运算、处理大型矩阵、成熟的广播函数库、矢量运算、线性代数、傅里叶变换、随机数生成、并可与C++ /Fortran语言无缝结合。Python v3默认安装已经包含了numpy。
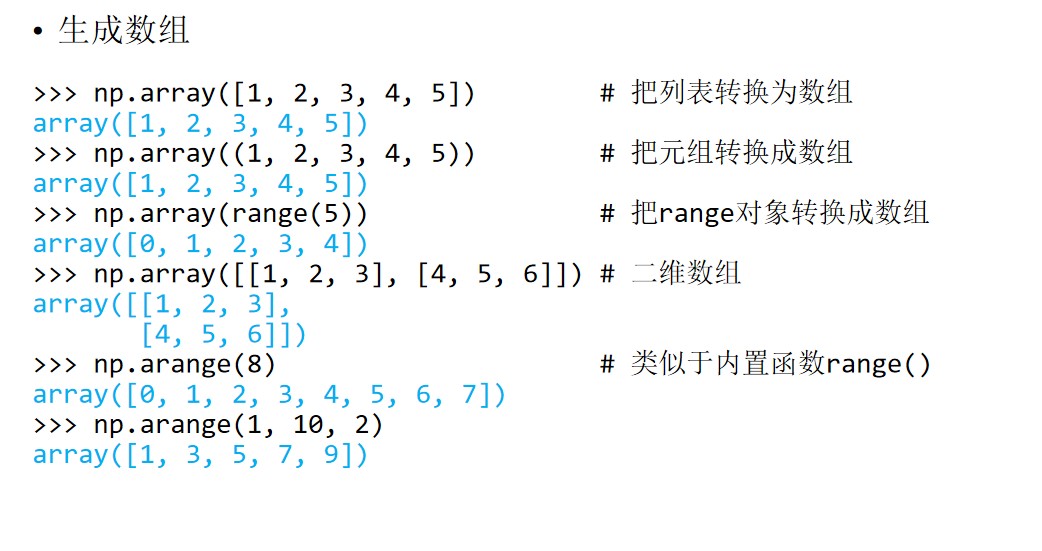
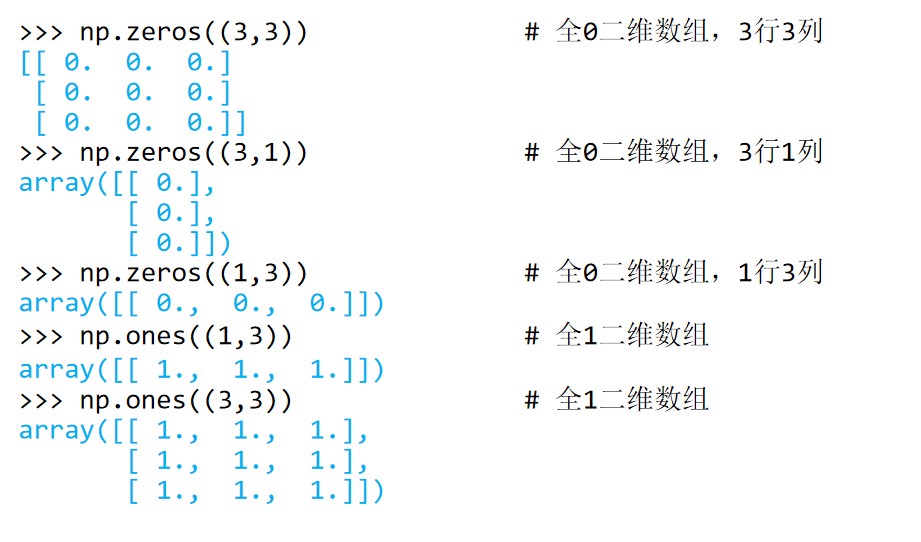
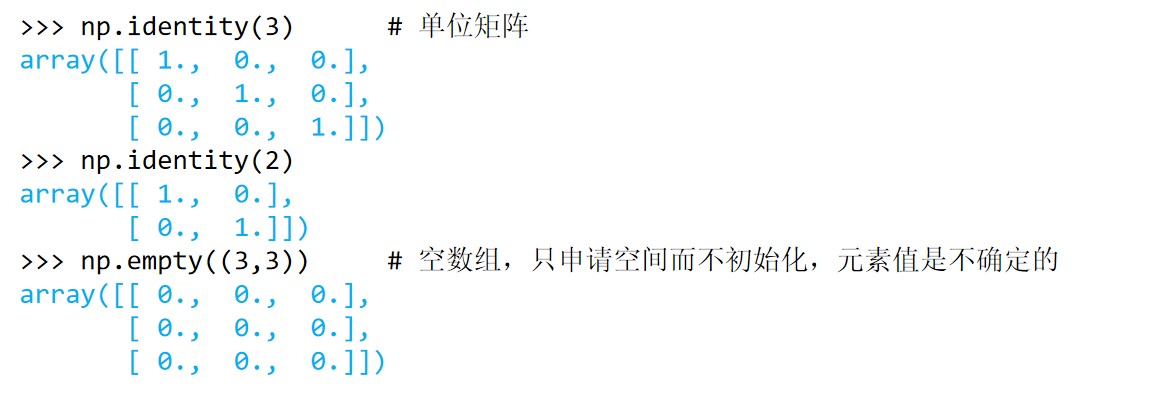
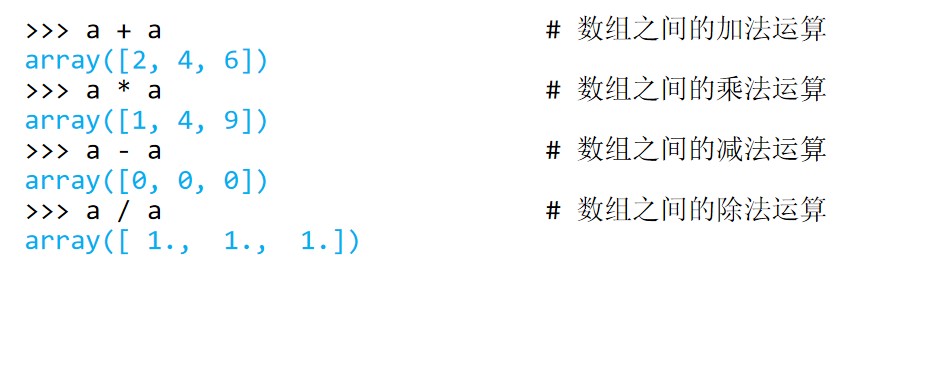
(1)导入模块:import numpy as np





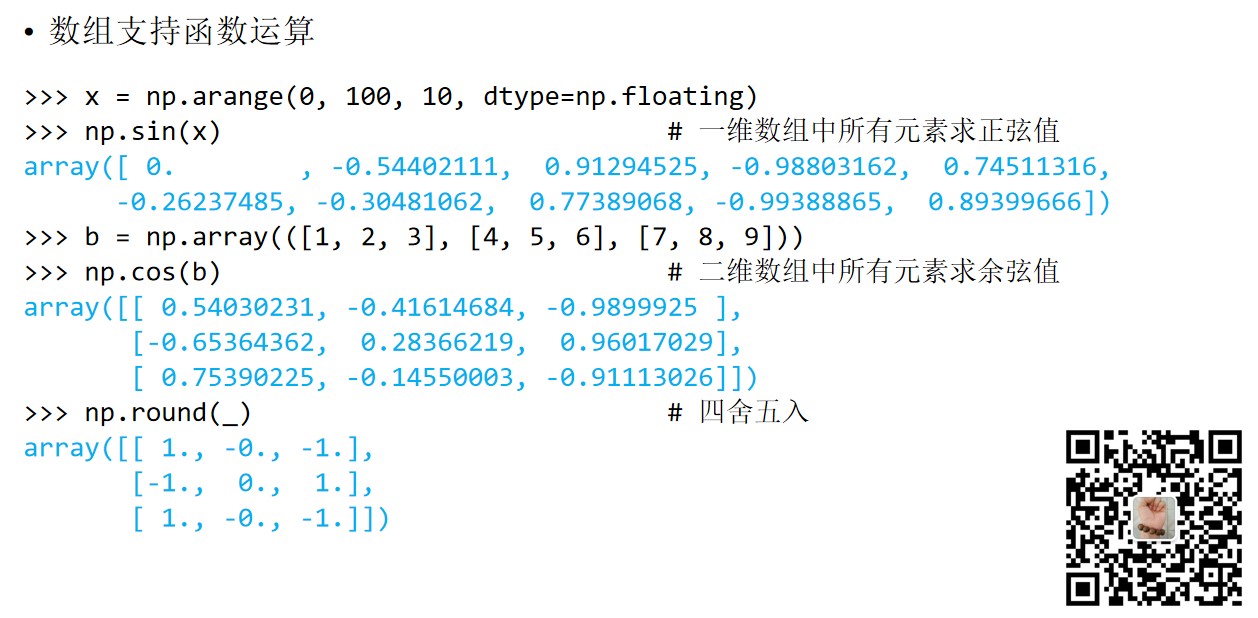

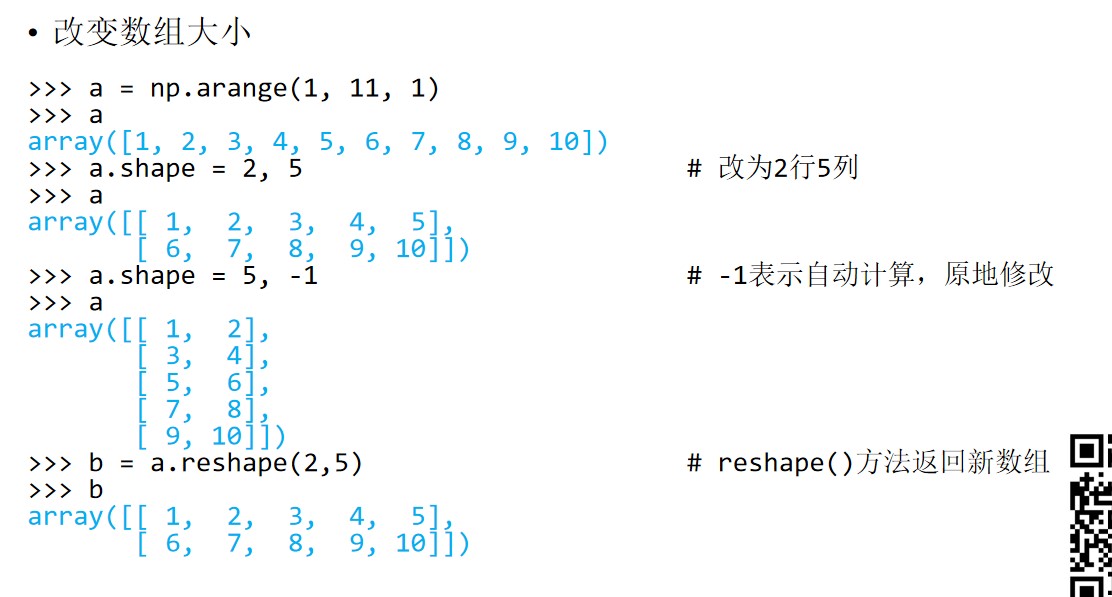
切片操作

>>> a = np.arange(10)
>>> a
array([0, 1, 2, 3, 4, 5, 6, 7, 8, 9])
>>> a[::-1]                           # 反向切片
array([9, 8, 7, 6, 5, 4, 3, 2, 1, 0])
>>> a[::2]                            # 隔一个取一个元素
array([0, 2, 4, 6, 8])
>>> a[:5]                             # 前5个元素
array([0, 1, 2, 3, 4])

>>> c = np.arange(25)     # 创建数组
>>> c.shape = 5,5         # 修改数组大小
>>> c
array([[ 0,  1,  2,  3,  4],
       [ 5,  6,  7,  8,  9],
       [10, 11, 12, 13, 14],
       [15, 16, 17, 18, 19],
       [20, 21, 22, 23, 24]])
>>> c[0, 2:5]             # 第0行中下标[2,5)之间的元素值
array([2, 3, 4])
>>> c[1]                  # 第0行所有元素
array([5, 6, 7, 8, 9])
>>> c[2:5, 2:5]           # 行下标和列下标都介于[2,5)之间的元素值
array([[12, 13, 14],
       [17, 18, 19],
       [22, 23, 24]])
布尔运算
>>> x = np.random.rand(10) # 包含10个随机数的数组
>>> x
array([ 0.56707504,  0.07527513,  0.0149213 ,  0.49157657,  0.75404095,
      0.40330683,  0.90158037,  0.36465894,  0.37620859,  0.62250594])
>>> x > 0.5               # 比较数组中每个元素值是否大于0.5
array([ True, False, False, False,  True, False,  True, False, False,  True], dtype=bool)
>>> x[x>0.5]              # 获取数组中大于0.5的元素,可用于检测和过滤异常值
array([ 0.56707504,  0.75404095,  0.90158037,  0.62250594])
>>> x < 0.5
array([False,  True,  True,  True, False,  True, False,  True,  True, False], dtype=bool)
>>> np.all(x<1)           # 测试是否全部元素都小于1
True
>>> np.any([1,2,3,4])         # 是否存在等价于True的元素
True
>>> np.any([0])
False
>>> a = np.array([1, 2, 3])
>>> b = np.array([3, 2, 1])
>>> a > b                     # 两个数组中对应位置上的元素比较
array([False, False,  True], dtype=bool)
>>> a[a>b]
array([3])
>>> a == b
array([False,  True, False], dtype=bool)
>>> a[a==b]
array([2])
取整运算

>>> x = np.random.rand(10)*50      # 10个随机数
>>> x
array([ 43.85639765,  30.47354735,  43.68965984,  38.92963767,
         9.20056878,  21.34765863,   4.61037809,  17.99941701,
        19.70232038,  30.05059154])
>>> np.int64(x)                    # 取整
array([43, 30, 43, 38,  9, 21,  4, 17, 19, 30], dtype=int64)
>>> np.int32(x)
array([43, 30, 43, 38,  9, 21,  4, 17, 19, 30])
>>> np.int16(x)
array([43, 30, 43, 38,  9, 21,  4, 17, 19, 30], dtype=int16)
>>> np.int8(x)
array([43, 30, 43, 38,  9, 21,  4, 17, 19, 30], dtype=int8)
广播

>>> a = np.arange(0,60,10).reshape(-1,1)     # 列向量
>>> b = np.arange(0,6)                       # 行向量
>>> a
array([[ 0],
       [10],
       [20],
       [30],
       [40],
       [50]])
>>> b
array([0, 1, 2, 3, 4, 5])
>>> a[0] + b                                 # 数组与标量的加法
array([0, 1, 2, 3, 4, 5])
>>> a[1] + b
array([10, 11, 12, 13, 14, 15])
>>> a + b
array([[ 0,  1,  2,  3,  4,  5],
       [10, 11, 12, 13, 14, 15],
       [20, 21, 22, 23, 24, 25],
       [30, 31, 32, 33, 34, 35],
       [40, 41, 42, 43, 44, 45],
       [50, 51, 52, 53, 54, 55]])
>>> a * b
array([[  0,   0,   0,   0,   0,   0],
       [  0,  10,  20,  30,  40,  50],
       [  0,  20,  40,  60,  80, 100],
       [  0,  30,  60,  90,  120, 150],
       [  0,  40,  80,  120, 160, 200],
       [  0,  50,  100, 150,  200, 250]])
分段函数

>>> x = np.random.randint(0, 10, size=(1,10))
>>> x
array([[0, 4, 3, 3, 8, 4, 7, 3, 1, 7]])
>>> np.where(x<5, 0, 1)            # 小于5的元素值对应0,其他对应1
array([[0, 0, 0, 0, 1, 0, 1, 0, 0, 1]])
>>> np.piecewise(x, [x<4, x>7], [lambda x:x*2, lambda x:x*3])
                                   # 小于4的元素乘以2
                                   # 大于7的元素乘以3
                                   # 其他元素变为0
array([[ 0,  0,  6,  6, 24,  0,  0,  6,  2,  0]])


计算唯一值以及出现次数

>>> x = np.random.randint(0, 10, 7)
>>> x
array([8, 7, 7, 5, 3, 8, 0])
>>> np.bincount(x)   # 元素出现次数,0出现1次,
                     # 1、2没出现,3出现1次,以此类推
array([1, 0, 0, 1, 0, 1, 0, 2, 2], dtype=int64)
>>> np.sum(_)        # 所有元素出现次数之和等于数组长度
7
>>> np.unique(x)     # 返回唯一元素值
array([0, 3, 5, 7, 8])


矩阵运算

>>> a_list = [3, 5, 7]
>>> a_mat = np.matrix(a_list)            # 创建矩阵
>>> a_mat
matrix([[3, 5, 7]])
>>> a_mat.T                              # 矩阵转置
matrix([[3],
        [5],
        [7]])
>>> a_mat.shape                          # 矩阵形状
(1, 3)
>>> a_mat.size                           # 元素个数
3
>>> a_mat.mean()                         # 元素平均值
5.0
>>> a_mat.sum()                          # 所有元素之和
15
>>> a_mat.max()                          # 最大值
7

>>> a_mat.max(axis=1)                    # 横向最大值
matrix([[7]])
>>> a_mat.max(axis=0)                    # 纵向最大值
matrix([[3, 5, 7]])
>>> b_mat = np.matrix((1, 2, 3))         # 创建矩阵
>>> b_mat
matrix([[1, 2, 3]])
>>> a_mat * b_mat.T                      # 矩阵相乘
matrix([[34]])

>>> c_mat = np.matrix([[1, 5, 3], [2, 9, 6]]) # 创建二维矩阵
>>> c_mat
matrix([[1, 5, 3],
        [2, 9, 6]])
>>> c_mat.argsort(axis=0)                     # 纵向排序后的元素序号
matrix([[0, 0, 0],
        [1, 1, 1]], dtype=int64)
>>> c_mat.argsort(axis=1)                     # 横向排序后的元素序号
matrix([[0, 2, 1],
        [0, 2, 1]], dtype=int64)
>>> d_mat = np.matrix([[1, 2, 3], [4, 5, 6], [7, 8, 9]])
>>> d_mat.diagonal()                          # 矩阵对角线元素
matrix([[1, 5, 9]])
矩阵不同维度上的计算

>>> x = np.matrix(np.arange(0,10).reshape(2,5))  # 二维矩阵
>>> x
matrix([[0, 1, 2, 3, 4],
        [5, 6, 7, 8, 9]])
>>> x.sum()                                      # 所有元素之和
45
>>> x.sum(axis=0)                                # 纵向求和
matrix([[ 5,  7,  9, 11, 13]])
>>> x.sum(axis=1)                                # 横向求和
matrix([[10],
        [35]])
>>> x.mean()                                     # 平均值
4.5
>>> x.mean(axis=1)
matrix([[ 2.],
        [ 7.]])
>>> x.mean(axis=0)
matrix([[ 2.5,  3.5,  4.5,  5.5,  6.5]])

>>> x.max()                                # 所有元素最大值
9
>>> x.max(axis=0)                          # 纵向最大值
matrix([[5, 6, 7, 8, 9]])
>>> x.max(axis=1)                          # 横向最大值
matrix([[4],
        [9]])
>>> weight = [0.3, 0.7]                    # 权重
>>> np.average(x, axis=0, weights=weight)
matrix([[ 3.5,  4.5,  5.5,  6.5,  7.5]])

>>> x = np.matrix(np.random.randint(0, 10, size=(3,3)))
>>> x
matrix([[3, 7, 4],
        [5, 1, 8],
        [2, 7, 0]])
>>> x.std()                         # 标准差
2.6851213274654606
>>> x.std(axis=1)                   # 横向标准差
matrix([[ 1.69967317],
        [ 2.86744176],
        [ 2.94392029]])
>>> x.std(axis=0)                   # 纵向标准差
matrix([[ 1.24721913,  2.82842712,  3.26598632]])
>>> x.var(axis=0)                   # 纵向方差
matrix([[  1.55555556,   8.        ,  10.66666667]])
2.matplotlib模块:依赖于numpy模块和tkinter模块,可以绘制多种形式的图形,包括线图、直方图、饼状图、散点图、误差线图等等,图形质量可满足出版要求,是数据可视化的重要工具。
二、使用numpy、matplotlib模块绘制雷达图
import numpy as np
import matplotlib.pyplot as plt

# 中文和负号的正常显示
plt.rcParams['font.sans-serif'] = 'Microsoft YaHei'
plt.rcParams['axes.unicode_minus'] = False

# 使用ggplot的绘图风格
plt.style.use('ggplot')

# 构造数据
values = [5,5,5,5,5,5,5]
feature = ['第一周','第二周','第三周','第四周','第五周','第六周','第七周']

N = len(values)
# 设置雷达图的角度,用于平分切开一个圆面
angles=np.linspace(0, 2*np.pi, N, endpoint=False)
# 为了使雷达图一圈封闭起来,需要下面的步骤
values=np.concatenate((values,[values[0]]))
angles=np.concatenate((angles,[angles[0]]))

# 绘图
fig=plt.figure()
ax = fig.add_subplot(111, polar=True)
# 绘制折线图
ax.plot(angles, values, 'o-', linewidth=2, label = '学号2019310143016')
# 填充颜色
ax.fill(angles, values, alpha=0.35)

# 添加每个特征的标签
ax.set_thetagrids(angles * 180/np.pi, feature)
# 设置雷达图的范围
ax.set_ylim(0,5)
# 添加标题
plt.title('纯牛奶的成绩单')

# 添加网格线
ax.grid(True)
# 设置图例
plt.legend(loc = 'best')
# 显示图形
plt.show()

三、使用PIL、numpy模块绘制自定义手绘风
from PIL import Image
import numpy as np

a = np.asarray(Image.open("xiaoxiao.jpg").convert("L")).astype("float")

depth = 50
grad = np.gradient(a)

grad_x, grad_y = grad
grad_x = grad_x*depth/100
grad_y = grad_y*depth/100
A = np.sqrt(grad_x**2 + grad_y**2 + 1.)
uni_x = grad_x/A
uni_y = grad_y/A
uni_z = 1./A

vec_el = np.pi/2.2
vec_az = np.pi/4.
dx = np.cos(vec_el)*np.cos(vec_az)
dy = np.cos(vec_el)*np.sin(vec_az)
dz = np.sin(vec_el)

b = 255*(dx*uni_x + dy*uni_y + dz*uni_z)
b = b.clip(0, 255)

im = Image.fromarray(b.astype('uint8'))
im.save("b.jpg")
原图:

结果:

四、科学计算、绘制sinx、cosx的数学规律
import numpy as np
import pylab as pl
import matplotlib.font_manager as fm
myfont = fm.FontProperties(fname=r'C:WindowsFontsSTKAITI.ttf')
t = np.arange(0.0, 2.0*np.pi, 0.01)
s = np.sin(t)
z = np.cos(t)
pl.plot(t, s, label='正弦')
pl.plot(t, z, label='余弦')
pl.xlabel('x-变量', fontproperties='STKAITI', fontsize=18)
pl.ylabel('y-正弦余弦函数值', fontproperties='simhei', fontsize=18)
pl.title('sin-cos函数图像', fontproperties='STLITI', fontsize=24)
pl.legend(prop=myfont)
pl.show()
