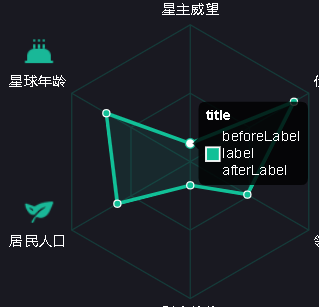
zoukankan      html  css  js  c++  java
  • chart.js tooltip自定义样式

    效果图:

    关键代码:

    var options = {
                    legend: false,
                    gridLines: {
                        display: false
                    },
                    // labels: {
                    //     style: {
                    //         fontSize: "16",
                    //         color: "#fff",
                    //     },
                    // },
                    tooltips: {
                        callbacks: {
                            title: function() {
                                return "title";
                            },
                            beforeLabel: function(tooltipItem, data) {
                                return "beforeLabel";
                            },
                            label: function(tooltipItem, data) {
                                return "label";
                            },
                            afterLabel: function(tooltipItem, data) {
                                return "afterLabel";
                            }
                        }
                    },
                    scale: {
                        gridLines: {
                            color: "#143C3A"
                        },
                        angleLines: {
                            color: "#143C3A"
                        },
                        ticks: {
                            maxTicksLimit: 4,
                            display: false
                        },
                        pointLabels: {
                            fontSize: 12,
                            fontColor: "#fff"
                        }
                    },
                    scaleShowLine: true,
                    angleShowLineOut: true,
                    scaleShowLabels: true,
                    scaleBeginAtZero: true,
                    angleLineColor: "rgba(0,0,0,.1)",
                    angleLineWidth: 1,
                    pointLabelFontFamily: "'Arial'",
                    pointLabelFontStyle: "normal",
                    pointLabelFontSize: 16,
                    pointLabelFontColor: "#fff",
                    pointDot: true,
                    pointDotRadius: 5,
                    pointDotStrokeWidth: 1,
                    pointHitDetectionRadius: 40,
                    datasetStroke: true,
                    datasetStrokeWidth: 3,
                    datasetFill: true,
                    responsive: true,
    
                    //字符串-图例模板
                    legendTemplate:
                        '<ul class="<%=name.toLowerCase()%>-legend"><% for (var i=0; i<datasets.length; i++){%><li><span style="background-color:<%=datasets[i].strokeColor%>"></span><%if(datasets[i].label){%><%=datasets[i].label%><%}%></li><%}%></ul>'
                };
    View Code

    文档:

    http://chartjs.cn/docs/#radar-chart-example-usage

  • 相关阅读:
    day 12 元组的魔法
    day 12 列表的魔法,及灰魔法
    day 11 Python课上练习解释与基础知识练习题试题一
    day 11 rang的用法和练习
    day 10 字符串的魔法
    day1 Python可变与不可变类型
    day1 数据类型
    Math对象
    Calendar对象
    Date对象
  • 原文地址:https://www.cnblogs.com/codeDevotee/p/14236020.html
Copyright © 2011-2022 走看看