
目前准备通过
netstat -s ethtool -S cat /proc/net/dev cat /proc/net/snmp
cat /sys/class/net/<NIC>/statistics/
查看drop 统计
同时通过sar -n DEV 1 5 查看流量
tcpdump 抓包分析 报文特征
已经交给前场提取数据
其实想用dropwatch分析但是 现场不支持


1、首先内核必须大于等于2.6.30;

2、编译内核时应该加上“NET_DROP_MONITOR=y”;
明天处理!!!!!
目前收集的信息中有比较重要有用的信息为:
     rx_no_buffer_count: 180972127
     rx_missed_errors: 127669376
root@localhost / # cat /proc/net/snmp
Ip: Forwarding DefaultTTL InReceives InHdrErrors InAddrErrors ForwDatagrams InUnknownProtos InDiscards InDelivers OutRequests OutDiscards OutNoRoutes ReasmTimeout ReasmReqds ReasmOKs ReasmFails FragOKs FragFails FragCreates
Ip: 2 64 43266916579 0 58 0 0 0 43266916521 39496151188 19 1096 0 0 0 0 687465 0 1577650
Icmp: InMsgs InErrors InDestUnreachs InTimeExcds InParmProbs InSrcQuenchs InRedirects InEchos InEchoReps InTimestamps InTimestampReps InAddrMasks InAddrMaskReps OutMsgs OutErrors OutDestUnreachs OutTimeExcds OutParmProbs OutSrcQuenchs OutRedirects OutEchos OutEchoReps OutTimestamps OutTimestampReps OutAddrMasks OutAddrMaskReps
Icmp: 10609 83 10226 217 0 0 0 151 15 0 0 0 0 43171445 0 43171273 0 0 0 0 26 146 0 0 0 0
IcmpMsg: InType0 InType3 InType8 InType11 OutType0 OutType3 OutType8
IcmpMsg: 15 10226 151 217 146 43171273 26
Tcp: RtoAlgorithm RtoMin RtoMax MaxConn ActiveOpens PassiveOpens AttemptFails EstabResets CurrEstab InSegs OutSegs RetransSegs InErrs OutRsts
Tcp: 1 200 120000 -1 638924225 792069897 51631303 76843627 105 43070509878 47284276280 4631429 0 60909693
Udp: InDatagrams NoPorts InErrors OutDatagrams RcvbufErrors SndbufErrors
Udp: 195179897 532 1998 218221001 0 0
UdpLite: InDatagrams NoPorts InErrors OutDatagrams RcvbufErrors SndbufErrors
UdpLite: 0 0 0 0 0 0
root@localhost / # netstat -s
Ip:
    317249965 total packets received
    58 with invalid addresses
    0 forwarded
    0 incoming packets discarded
    317249907 incoming packets delivered
    841450781 requests sent out
    19 outgoing packets dropped
    1096 dropped because of missing route
    687465 fragments received ok
    1577650 fragments created
Icmp:
    10609 ICMP messages received
    83 input ICMP message failed.
    ICMP input histogram:
        destination unreachable: 10226
        timeout in transit: 217
        echo requests: 151
        echo replies: 15
    43171452 ICMP messages sent
    0 ICMP messages failed
    ICMP output histogram:
        destination unreachable: 43171280
        echo request: 26
        echo replies: 146
IcmpMsg:
        InType0: 15
        InType3: 10226
        InType8: 151
        InType11: 217
        OutType0: 146
        OutType3: 43171280
        OutType8: 26
Tcp:
    638924267 active connections openings
    792070011 passive connection openings
    51631325 failed connection attempts
    76843631 connection resets received
    98 connections established
    120843208 segments received
    39642604 segments send out
    4631433 segments retransmited
    0 bad segments received.
    60909716 resets sent
Udp:
    195179954 packets received
    532 packets to unknown port received.
    1998 packet receive errors
    218221066 packets sent
    0 receive buffer errors
    0 send buffer errors
UdpLite:
TcpExt:
    947 resets received for embryonic SYN_RECV sockets
    148679 packets pruned from receive queue because of socket buffer overrun
    531225716 TCP sockets finished time wait in fast timer
    347738973 delayed acks sent
    2698538 delayed acks further delayed because of locked socket
    Quick ack mode was activated 2595825 times
    28481169 packets directly queued to recvmsg prequeue.
    6717820 bytes directly in process context from backlog
    1033332179 bytes directly received in process context from prequeue
    1010153350 packet headers predicted
    14758935 packets header predicted and directly queued to user
    3242078974 acknowledgments not containing data payload received
    3880126246 predicted acknowledgments
    1536 times recovered from packet loss due to fast retransmit
    13263 times recovered from packet loss by selective acknowledgements
    1733 congestion windows recovered without slow start by DSACK
    136942 congestion windows recovered without slow start after partial ack
    16400 TCP data loss events
    TCPLostRetransmit: 639
    1574 timeouts after reno fast retransmit
    14245 timeouts after SACK recovery
    78 timeouts in loss state
    50060 fast retransmits
    4432 forward retransmits
    16193 retransmits in slow start
    4159092 other TCP timeouts
    86 classic Reno fast retransmits failed
    552 SACK retransmits failed
    22768427 packets collapsed in receive queue due to low socket buffer
    3110543 DSACKs sent for old packets
    57636 DSACKs sent for out of order packets
    34337 DSACKs received
    9 DSACKs for out of order packets received
    4438261 connections reset due to unexpected data
    4890686 connections reset due to early user close
    21201 connections aborted due to timeout
    TCPSACKDiscard: 2
    TCPDSACKIgnoredOld: 22762
    TCPDSACKIgnoredNoUndo: 7791
    TCPSpuriousRTOs: 1396
    TCPSackShifted: 42109
    TCPSackMerged: 43323
    TCPSackShiftFallback: 63448
    TCPBacklogDrop: 1435
    TCPDeferAcceptDrop: 139642
    TCPTimeWaitOverflow: 171130
IpExt:
    InMcastPkts: 5
    InBcastPkts: 1213607
    InOctets: 1673780726
    OutOctets: -1198119745
    InMcastOctets: 140
    InBcastOctets: 104766229
root@localhost / # ethtool -S eth1
NIC statistics:
     rx_packets: 27862085998
     tx_packets: 1262711762
     rx_bytes: 2039732992330
     tx_bytes: 125303834249
     rx_broadcast: 35401078
     tx_broadcast: 26016705
     rx_multicast: 54576108
     tx_multicast: 808459
     rx_errors: 0
     tx_errors: 0
     tx_dropped: 0
     multicast: 54576108
     collisions: 0
     rx_length_errors: 0
     rx_over_errors: 0
     rx_crc_errors: 0
     rx_frame_errors: 0
     rx_no_buffer_count: 1571897
     rx_missed_errors: 1390
     tx_aborted_errors: 0
     tx_carrier_errors: 0
     tx_fifo_errors: 0
     tx_heartbeat_errors: 0
     tx_window_errors: 0
     tx_abort_late_coll: 0
     tx_deferred_ok: 0
     tx_single_coll_ok: 0
     tx_multi_coll_ok: 0
     tx_timeout_count: 0
     tx_restart_queue: 0
     rx_long_length_errors: 0
     rx_short_length_errors: 0
     rx_align_errors: 0
     tx_tcp_seg_good: 0
     tx_tcp_seg_failed: 0
     rx_flow_control_xon: 0
     rx_flow_control_xoff: 0
     tx_flow_control_xon: 220291
     tx_flow_control_xoff: 221680
     rx_long_byte_count: 2039732992330
     rx_csum_offload_good: 27739152135
     rx_csum_offload_errors: 0
     rx_header_split: 0
     alloc_rx_buff_failed: 0
     tx_smbus: 0
     rx_smbus: 0
     dropped_smbus: 0
     rx_dma_failed: 0
     tx_dma_failed: 0
root@localhost / # ethtool -S eth2
NIC statistics:
     rx_packets: 1261353932
     tx_packets: 27862955528
     rx_bytes: 125372925112
     tx_bytes: 2040275968171
     rx_broadcast: 25614225
     tx_broadcast: 35423396
     rx_multicast: 808438
     tx_multicast: 54576132
     rx_errors: 0
     tx_errors: 0
     tx_dropped: 0
     multicast: 808438
     collisions: 0
     rx_length_errors: 0
     rx_over_errors: 0
     rx_crc_errors: 0
     rx_frame_errors: 0
     rx_no_buffer_count: 180972127
     rx_missed_errors: 127669376
     tx_aborted_errors: 0
     tx_carrier_errors: 0
     tx_fifo_errors: 0
     tx_heartbeat_errors: 0
     tx_window_errors: 0
     tx_abort_late_coll: 0
     tx_deferred_ok: 0
     tx_single_coll_ok: 0
     tx_multi_coll_ok: 0
     tx_timeout_count: 0
     tx_restart_queue: 0
     rx_long_length_errors: 0
     rx_short_length_errors: 0
     rx_align_errors: 0
     tx_tcp_seg_good: 0
     tx_tcp_seg_failed: 0
     rx_flow_control_xon: 0
     rx_flow_control_xoff: 0
     tx_flow_control_xon: 0
     tx_flow_control_xoff: 0
     rx_long_byte_count: 125372925112
     rx_csum_offload_good: 1228845122
     rx_csum_offload_errors: 10
     rx_header_split: 0
     alloc_rx_buff_failed: 0
     tx_smbus: 0
     rx_smbus: 0
     dropped_smbus: 0
     rx_dma_failed: 0
     tx_dma_failed: 0
root@localhost / # cat /proc/net/dev
Inter-|   Receive                                                |  Transmit
 face |bytes    packets errs drop fifo frame compressed multicast|bytes    packets errs drop fifo colls carrier compressed
    lo: 384657885396 1478036246    0    0    0     0          0         0 384657885396 1478036246    0    0    0     0       0          0
 bond0:       0       0    0    0    0     0          0         0        0       0    0    0    0     0       0          0
  eth0: 1820898757 15863793    0    0    0     0          0         0 26863219776 242854331    0    0    0     0       0          0
 teql0:       0       0    0    0    0     0          0         0        0       0    0    0    0     0       0          0
  sit0:       0       0    0    0    0     0          0         0        0       0    0    0    0     0       0          0
  eth1: 2039734404414 27862095641    0 1390    0     0          0  54576108 125317855145 1262724651    0    0    0     0       0          0
  eth2: 125385953071 1261365428    0 127669376    0     0          0    808463 2040277248858 27862964224    0    0    0     0       0          0
  eth3: 27566182128841 397592489315    0    0    0     0          0    769327 70776340796697 437380843982    0    0    0     0       0          0
  eth4: 71536212472219 436926157198    0 14415212551    0     0          0  54574179 27741862259957 401183191271    0    0    0     0       0          0
  eth5: 39944246780346 43763462640    0 2456    0     0          0       277 35696516892117 36611633993    0    0    0     0       0          0
  eth6: 35697179600486 36611633978    0    0    0     0          0  76995504 39944845468824 43763451889    0    0    0     0       0          0
eth1.1:       0       0    0    0    0     0          0         0     1026      13    0    0    0     0       0          0
eth2.1:       0       0    0    0    0     0          0         0      936      12    0    0    0     0       0          0
eth3.1:       0       0    0    0    0     0          0         0      936      12    0    0    0     0       0          0
eth4.1:       0       0    0    0    0     0          0         0      558       7    0    0    0     0       0          0
eth5.1:       0       0    0    0    0     0          0         0     1494      19    0    0    0     0       0          0
eth6.1:       0       0    0    0    0     0          0         0      468       6    0    0    0     0       0          0
查看驱动代码看下 rx_no_buffer_count 以及rx_missed_errors 是怎么来的吧
mpc = E1000_READ_REG(hw, E1000_MPC);

adapter->stats.mpc += mpc;

IGB_STAT("rx_missed_errors", stats.mpc),
IGB_STAT("rx_no_buffer_count", stats.rnbc),
 adapter->stats.rnbc += E1000_READ_REG(hw, E1000_RNBC);
这几个参数都是从 芯片寄存器读取出来的:
大概意思是;
rx_no_buffer_count = E1000_RNBC
rx_missed_error = E1000_MPC
在网上收了一下 RNBC 以及MPC 得到了如下一段话:
Missed Packets Count – MPC
Counts the number of missed packets. Packets are missed when the receive FIFO has insufficient space to store the incoming packet. This can be caused because of too few buffers allocated, or because there
is insufficient bandwidth on the PCI bus. Events setting this counter causes ICR.Rx Miss, the Receiver Overrun Interrupt, to be set. This register does not increment if receives are not enabled.
These packets are also counted in the Total Packets Received register as well as in Total Octets Received.
rx_missed_errors与硬中断有关。也就是在DMA传送完,发送硬中断之前,网卡的FIFO缓冲已经满了,导致接收的数据要立即丢掉;按道理调整 rx fifo ethtool -G ethx xxx 就可以吧!!!
也可能这样理解是错误的-----------------------------------------
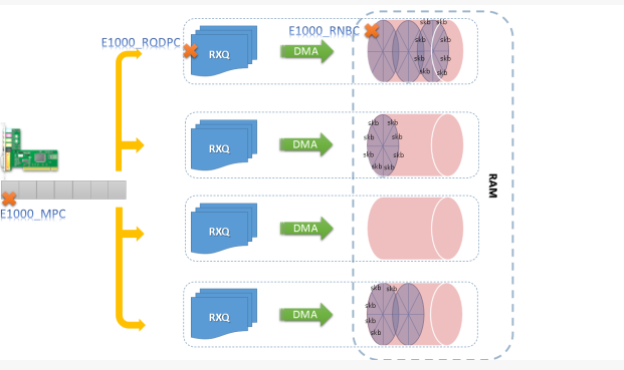
Receive No Buffers Count – RNBC
This register counts the number of times that frames were received when there were no available buffers in host memory to store those frames (receive descriptor head and tail pointers were equal).
The packet is still received if there is space in the FIFO. This register only increments if receives are enabled (RCTL.RXEN is set). This register does not increment when flow control packets are received.
rx_no_buffer_count 应该是指在网卡通过DMA将设备FIFO中的skb->data传送到rx_buffer_info时,发现对应的rx_buffer_info还没有unmap,也就无法送到内核memory主存。
也就是 和软中断处理的速度有关---系统处理数据较慢导致??
不知这样理解是否正确?????
参考:https://lp007819.wordpress.com/2013/05/
目前自己环境10g光口是出现一个现象:

ifconfig 的drop 和ethtool drop 不相等?
之前是一样的? 那这两个drop 是什么概念呢?port.drop呢?
-----大约看了一下驱动的意思; rx_dropped 就是表示 网卡 RNBC 问题; 确实也是 提高了 rx ring 就解决问题?
ifconfig ethx 这个参数的意义是?
RX dropped: 应该是 内核协议栈丢弃的报文+ 网卡fifo不够丢弃的吧!!!
RX overruns:rx_fifo_errors ?? 应该和rx_missed_errors 差不多: 表示网卡 fifo 不够吧!!不过具体网卡驱动其值不一样
RX frames:不知道
算了驱动不同 其值不一样 ;具体问题具体分析吧
看了一下 丢包时:ethtool 命令不错
其主要有 ethtool -S -g -G -i -a 啥的
一般都会查看工作模式是否正常以及CRC---Speed,Duplex,CRC overruns 是否一直增大 查看/修改网卡的buffer size情况
客户现场具体是什么问题?
网卡问题? 真的是报文速率过大? 还是??
下周再来看吧!!!
rx_over_errors: 0
     rx_crc_errors: 0
     rx_frame_errors: 0
     rx_no_buffer_count: 180972127
     rx_missed_errors: 127669376
这几个参数 ------ fifo-error missed-error no-buffer 下载 在详细看芯片手册-------------------------------