1.安装echarts依赖
npm install echarts -S
或者使用国内的淘宝镜像:
安装
npm install -g cnpm --registry=https://registry.npm.taobao.org
使用
cnpm install echarts -S
2.创建图表
全局引入
main.js
// 引入echarts
import echarts from 'echarts'
Vue.prototype.$echarts = echarts
Hello.vue
<div id="myChart" :style="{ '300px', height: '300px'}"></div>
3.mounted 中调用 (mounted 是 vue 的生命周期,表示挂载完毕,html 已经渲染)
mounted(){
    this.$nextTick(function() {
        this.drawPie('myChart')
    })
}
4.组件
<template>
  	<!--为echarts准备一个具备大小的容器dom-->
  	<div id="myChart" style="300px;height:300px;"></div>
</template>

<script>
    export default {
        name: '',
        data () {
            return {
                charts: '',
                opinion:['直接访问','邮件营销','联盟广告','视频广告','搜索引擎'],
                opinionData:[
                  	{value:335, name:'直接访问'},
                  	{value:310, name:'邮件营销'},
                  	{value:234, name:'联盟广告'},
                  	{value:135, name:'视频广告'},
                  	{value:1548, name:'搜索引擎'}
                ]
            }
        },
        methods:{
            drawPie(id){
               	this.charts = $echarts.init(document.getElementById(id));
               	this.charts.setOption({
                 	tooltip: {
                   		trigger: 'item',
                   		formatter: '{a}<br/>{b}:{c} ({d}%)'
                 	},
                 	legend: {
                   		orient: 'vertical',
                   		x: 'left',
                   		data:this.opinion
                 	},
                 	series: [
                   		{
                     		name:'访问来源',
                     		type:'pie',
                     		radius:['50%','70%'],
                     		avoidLabelOverlap: false,
                     		label: {
                       			normal: {
                         			show: false,
                         			position: 'center'
                       			},
                       			emphasis: {
                         			show: true,
                         			textStyle: {
                           				fontSize: '30',
                           				fontWeight: 'blod'
                         			}
                       			}
                     		},
                     		labelLine: {
                       			normal: {
                         			show: false
                       			}
                     		},
                     		data:this.opinionData
                   		}
                   	]
               	})
            }
        },
      	//调用
        mounted(){
            this.$nextTick(function() {
                this.drawPie('myChart')
            })
        }
    }
</script>

<style scoped>
    * {
        margin: 0;
        padding: 0;
        list-style: none;
    }
</style>
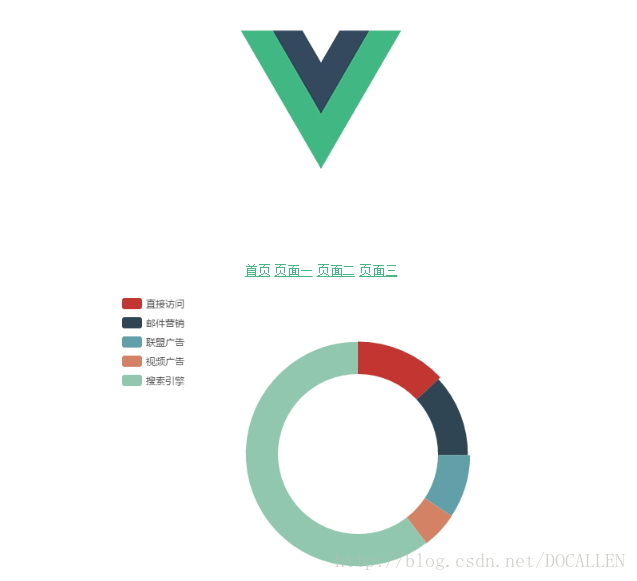
5.效果图
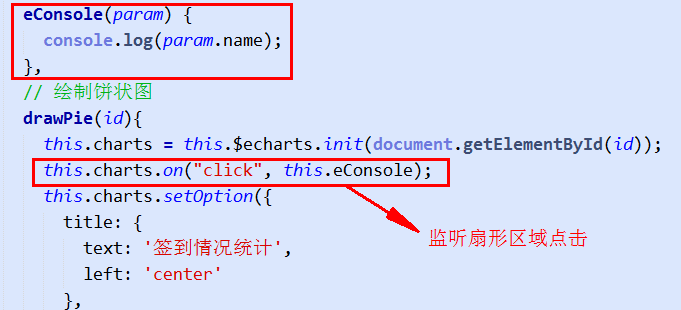
6.监听扇形区域点击事件