在react项目中使用过echarts
import React, { Component } from 'react'
import echarts from 'echarts'
// 指定图表的配置项和数据
let option = {
title: {
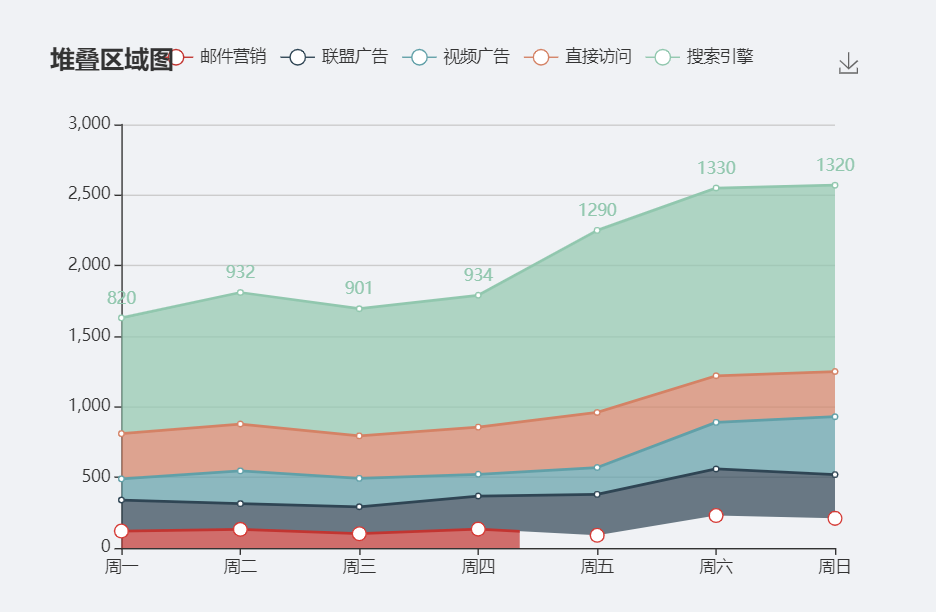
text: '堆叠区域图'
},
tooltip: {
trigger: 'axis',
axisPointer: {
type: 'cross',
label: {
backgroundColor: '#6a7985'
}
}
},
legend: {
data: ['邮件营销', '联盟广告', '视频广告', '直接访问', '搜索引擎']
},
toolbox: {
feature: {
saveAsImage: {}
}
},
grid: {
left: '3%',
right: '4%',
bottom: '3%',
containLabel: true
},
xAxis: [
{
type: 'category',
boundaryGap: false,
data: ['周一', '周二', '周三', '周四', '周五', '周六', '周日']
}
],
yAxis: [
{
type: 'value'
}
],
series: [
{
name: '邮件营销',
type: 'line',
stack: '总量',
areaStyle: {},
data: [120, 132, 101, 134, 90, 230, 210]
},
{
name: '联盟广告',
type: 'line',
stack: '总量',
areaStyle: {},
data: [220, 182, 191, 234, 290, 330, 310]
},
{
name: '视频广告',
type: 'line',
stack: '总量',
areaStyle: {},
data: [150, 232, 201, 154, 190, 330, 410]
},
{
name: '直接访问',
type: 'line',
stack: '总量',
areaStyle: {},
data: [320, 332, 301, 334, 390, 330, 320]
},
{
name: '搜索引擎',
type: 'line',
stack: '总量',
label: {
normal: {
show: true,
position: 'top'
}
},
areaStyle: {},
data: [820, 932, 901, 934, 1290, 1330, 1320]
}
]
};
export default class index extends Component {
componentDidMount(){
// 初始化echarts实例
this.dashboard = echarts.init(this.dash);
// 使用配置项
this.dashboard.setOption(option);
}
render() {
return (
<div>
<div ref={el=>this.dash=el} id="main" style={{"600px", height:"400px"}}></div>
</div>
)
}
}