import numpy as np
import random

# 随机选取样本的一部分作为随机样本进行随机梯度下降的小部分样本,x为元样本,row_size为随机样本的行数
# 随机取样本
def rand_x(x, row_size):
    xrow_lenth = x.shape[0]
    # print('元样本行数:{}行'.format(xrow_lenth))
    for i in range(row_size):
        # print(i)
        index = random.randint(0, xrow_lenth - 1)
        # print('index为:', index)
        # print('x[index,:]:', x[index, :])
        if i == 0:
            result = x[index, :]
        else:
            result = np.row_stack((result, x[index, :]))
    # print('result:', result, result.shape)
    return result
# x2 = rand_x(x, 6)
# print(x2)

# 简单的梯度下降优化,x为数据,y_t为标注值,w_p为优化后的参数值,step是梯度下降的步长
def W_update(x, y_t, w_p, step):
    # 测试输入值是否正确
    # print('开始梯度下降')
    # print('w_p:', w_p, w_p.shape)
    # 开始调整参数w_p
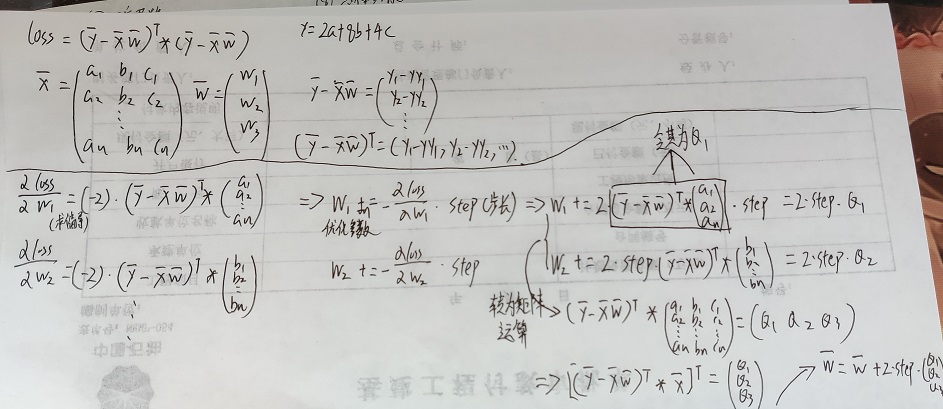
    w_p += 2 * step * (np.matmul((y_t - np.matmul(x, w_p)).T, x)).T  # 运用偏导数实现逐步逼近loss的最小值的梯度下降来优化参数w,见手写推导


######################函数调用实现功能########################
# 模拟数据集
#已知数据的模拟
x_col = 4                                                           # 几元函数,也就是x的列
x = np.random.randint(95, 100, (200, x_col))                        # 随机生成2000行n元的数据,数据值在70到100之间
w_t = np.array([355.0, 115.0, 4.0, 16.0]).reshape(x_col, 1)         # 初始化真实值的参数
y_true = np.matmul(x, w_t)                                          # 计算出真实值的结果向量作为标记值
#计算数据的初始化,和超参定义
w = np.array([0.0, 2.0, 5.0, 1.2]).reshape(x_col, 1)                # 初始化需要优化的参数向量,可以随机赋值
step = 0.000000088                                                   #学习步长
loss = np.matmul((y_true - np.matmul(x, w)).T, y_true - np.matmul(x, w))  # 梯度下降的损失函数
print("开始loss", loss)
num = 1
while loss > 10:                                                            #当loss小于10则停止
    x2 = rand_x(x, 300)                                                      #将元样本进行随机划分成小样本,这里分为300行
    y2_true = np.matmul(x2, w_t)
    W_update(x2, y2_true, w, step)                                              #开始优化参数w

    if num % 1000 == 0:                                                          #每1000次打印观察loss和w
        print('1000次啦@@@@@@@@@@@@@@@@@@@@@@@@@@@@@@@@@@@@@@@@@@@@@@@@')
        loss = np.matmul((y_true - np.matmul(x, w)).T, y_true - np.matmul(x, w))  # 梯度下降的损失函数
        print('此次loss:', loss)
        print('修改过后的w:', w)
    num += 1
测试参数真实值:
355.0, 115.0, 4.0, 16.0
实际结果:

参数W优化的算法推导:

