zoukankan      html  css  js  c++  java
  • echarts_部分图表配置_图表click事件

    额。。当然其他事件都是支持的,此文仅以click做简单介绍:
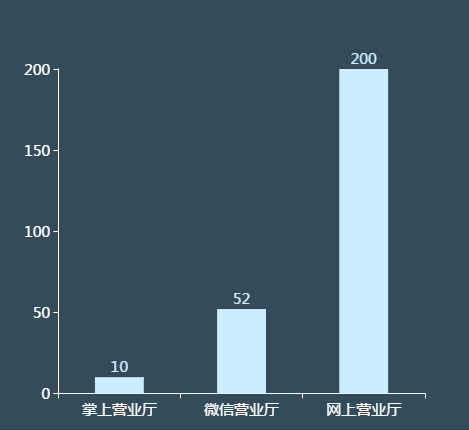
    请点击“柱子”。。。

    官方介绍:http://echarts.baidu.com/tutorial.html#ECharts%20%E4%B8%AD%E7%9A%84%E4%BA%8B%E4%BB%B6%E5%92%8C%E8%A1%8C%E4%B8%BA

      1 function bottom_z (thisId){
      2     var myChart = echarts.init(document.getElementById(thisId));
      3     option = {
      4             color: ['#fff'],
      5             textStyle:{
      6                 color:'#fff'
      7                 
      8             },
      9             tooltip : {
     10                 trigger: 'axis',
     11                 axisPointer : {            // 坐标轴指示器,坐标轴触发有效
     12                     type : 'shadow'        // 默认为直线,可选为:'line' | 'shadow'
     13                 }
     14             },
     15             grid: {
     16                 left: '3%',
     17                 right: '4%',
     18                 bottom: '3%',
     19                 containLabel: true
     20             },
     21             xAxis : [
     22                 {
     23                     type : 'category',
     24                     splitLine : {//去掉网格线
     25                         show : false
     26                     },
     27                     data : ['掌上营业厅', '微信营业厅','网上营业厅'],
     28                     axisLabel : {
     29                         show : true,
     30                         textStyle : {
     31                             color : '#FFF',
     32                             align : 'center',
     33                             fontSize: 15
     34                         }
     35                     },
     36                     axisTick: {
     37                         alignWithLabel: true
     38                     },
     39                     axisLine : {//设置轴线
     40                         lineStyle : {
     41                             color : '#FFF'
     42                         }
     43                     },
     44                     axisTick : {//设置刻度
     45                         lineStyle : {
     46                             color : '#FFF'
     47                         }
     48                     }
     49                 }
     50             ],
     51             yAxis : [
     52                 {
     53                     type : 'value',
     54                     splitLine : {//去掉网格线
     55                         show : false
     56                     },
     57                     axisLabel : {
     58                         show : true,
     59                         textStyle : {
     60                             color : '#FFF',
     61                             align : 'right',
     62                             fontSize: 15
     63                         }
     64                     },
     65                     axisLine : {
     66                         lineStyle : {
     67                             color : '#FFF'
     68                         }
     69                     },
     70                     axisTick : {
     71                         lineStyle : {
     72                             color : '#FFF'
     73                         }
     74                     }
     75                 }
     76             ],
     77             series : [
     78                 {
     79                     name:'',
     80                     type:'bar',
     81                     barWidth: '40%',
     82                     itemStyle : {
     83                         normal : {
     84                             color:'#ccecff',//柱状的颜色
     85                             label : {
     86                                   textStyle : {
     87                                       fontSize : '15',//柱状上的显示的文字大小
     88                                       color:'#ccecff'
     89                                   }
     90                               }
     91                         }
     92                     },
     93 
     94                     label : {
     95                         normal : {
     96                             show : true,//显示数字
     97                             position : 'top'
     98                         }
     99                     },
    100                     data:[10, 52, 200]
    101                 }
    102             ]
    103         };
    104     myChart.setOption(option);
    105      
    106     /* 添加柱状图的点击事件 */
    107     myChart.on('click',function(params){
    108         
    109         if(params.name === '掌上营业厅'){    /*params.name是横轴的被点击的name的值*/
    110             parent.window.location.href = '../../page/wap.html';/*因为在iframe中所以需要控制iframe外面的window对象,控制外部window需要添加一个parent(每一个iframe中有一个单独的window对象)*/
    111             sessionStorage.setItem('_paramsName_','掌上营业厅');//业务需求 跳转后通过session(当前存的值)判断二级菜单的显示
    112             return false
    113         };
    114         if(params.name === '微信营业厅'){
    115             parent.window.location.href = '../../page/weixin.html';
    116             sessionStorage.setItem('_paramsName_','微信营业厅');
    117             return false
    118         };
    119         if(params.name === '网上营业厅'){
    120             parent.window.location.href = '../../page/web.html';
    121             sessionStorage.setItem('_paramsName_','网上营业厅');
    122             return false
    123         };
    124     });
    125 }
    126 
    127 bottom_z ('lineChart_Z');

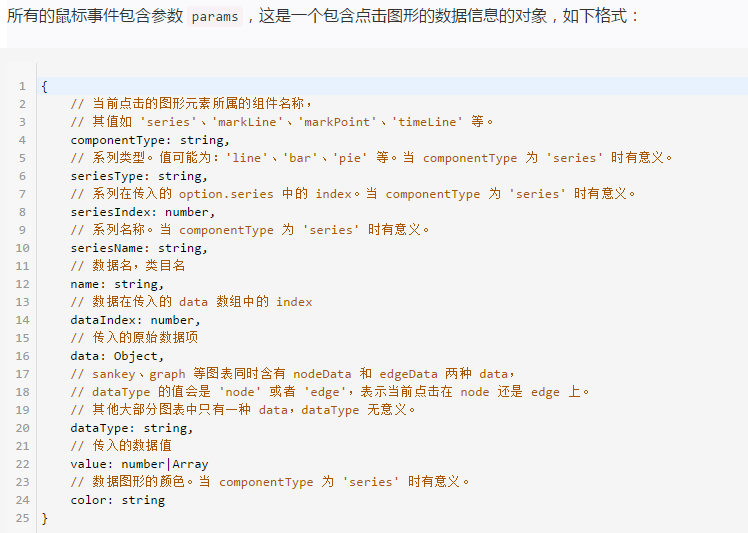
    添加事件在“107行”的代码注意参数“params”,如下格式:

    本文实现点击定向跳转的方式就是判断了当前的params.name然后进行业务跳转,快去试试吧(本文较初级如有错误还望指点)

  • 相关阅读:
    mysql 游标使用
    springboot 集成swagger2
    springboot + thymeleaf静态资源访问404
    Win10系列:VC++绘制几何图形1
    Win10系列:VC++媒体播放控制4
    Win10系列:VC++媒体播放控制3
    Win10系列:VC++媒体播放控制2
    Win10系列:VC++媒体播放控制1
    Win10系列:VC++媒体播放
    Win10系列:VC++文件选取
  • 原文地址:https://www.cnblogs.com/cy3664983/p/7280795.html
Copyright © 2011-2022 走看看