绘制bar图,类似于直方图:
 1 reviews = pd.read_csv('matplotlib_data_test\fandango_scores.csv')
 2 cols = ['FILM', 'RT_user_norm', 'Metacritic_user_nom',
 3         'IMDB_norm', 'Fandango_Ratingvalue', 'Fandango_Stars']
 4 norm_reviews = reviews[cols]
 5 print(norm_reviews[:1])
 6
 7 num_cols = ['RT_user_norm', 'Metacritic_user_nom',
 8             'IMDB_norm', 'Fandango_Ratingvalue', 'Fandango_Stars']
 9
10 bar_heights = norm_reviews.loc[0, num_cols].values
11 print(bar_heights)
12 bar_positions = np.arange(5) + 0.75
13 print(bar_positions)
14 fig, ax = plt.subplots()
15 ax.bar(bar_positions, bar_heights, 0.5)
16 plt.show()
运行结果:

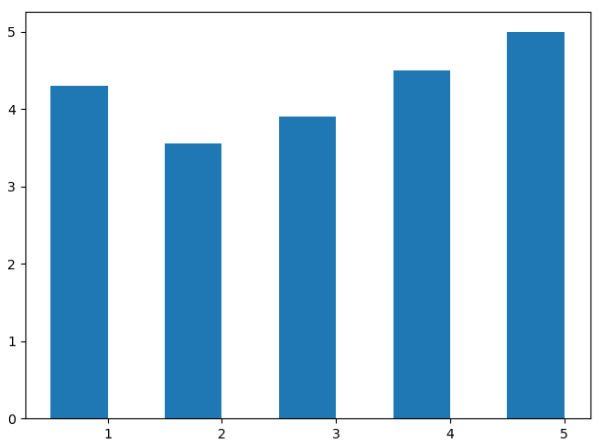
此时我们可以调整参数,让图更美观。
 1 num_cols = ['RT_user_norm', 'Metacritic_user_nom', 'IMDB_norm', 'Fandango_Ratingvalue', 'Fandango_Stars']
 2 bar_heights = norm_reviews.loc[0, num_cols].values
 3 bar_positions = np.arange(5) + 1  # 设置bar的位置
 4 tick_positions = range(1, 6)  # 设置刻度的位置
 5 fig, ax = plt.subplots()
 6 ax.bar(bar_positions, bar_heights, 0.5)
 7 ax.set_xticks(tick_positions)  # 要显示刻度名必须使用这个,不然刻度名会左移错位。
 8 ax.set_xticklabels(num_cols, rotation=90)
 9 #  设置坐标轴名称和图片主题
10 ax.set_xlabel('Rating Source')
11 ax.set_ylabel('Average Rating')
12 ax.set_title('Average User Rating For Avengers: Age of Ultron (2015)')
13 plt.show()
运行结果:

在很多时候,我们更希望这种图可以横着画,我们可以在画图的时候使用 ax.barh() 去画,其他命令一样。
效果如下:(这里是pycharm的效果,右边显示不完全)

绘制散点图
ax.scatter() 用来绘制散点图,如下:
1 fig, ax = plt.subplots()
2 ax.scatter(norm_reviews['Fandango_Ratingvalue'], norm_reviews['RT_user_norm'])
3 ax.set_xlabel('Fandango')
4 ax.set_ylabel('Rotten Tomatoes')
5 plt.show()
运行结果:

绘制两个子图:
 1 fig = plt.figure(figsize=(10, 5))
 2 ax1 = fig.add_subplot(1, 2, 1)
 3 ax2 = fig.add_subplot(1, 2, 2)
 4 # 绘制子图1
 5 ax1.scatter(norm_reviews['Fandango_Ratingvalue'], norm_reviews['RT_user_norm'])
 6 ax1.set_xlabel('Fandango')
 7 ax1.set_ylabel('Rotten Tomatoes')
 8 # 绘制子图2
 9 ax2.scatter(norm_reviews['RT_user_norm'], norm_reviews['Fandango_Ratingvalue'])
10 ax2.set_xlabel('Rotten Tomatoes')
11 ax2.set_ylabel('Fandango')
12 plt.show()
运行结果:

绘制直方图
ax.hist() 绘制直方图
1 fig, ax = plt.subplots()
2 ax.hist(norm_reviews['Fandango_Ratingvalue'], range=(4, 5), bins=20)  # 4-5 其实结束
3 plt.show()
运行结果:
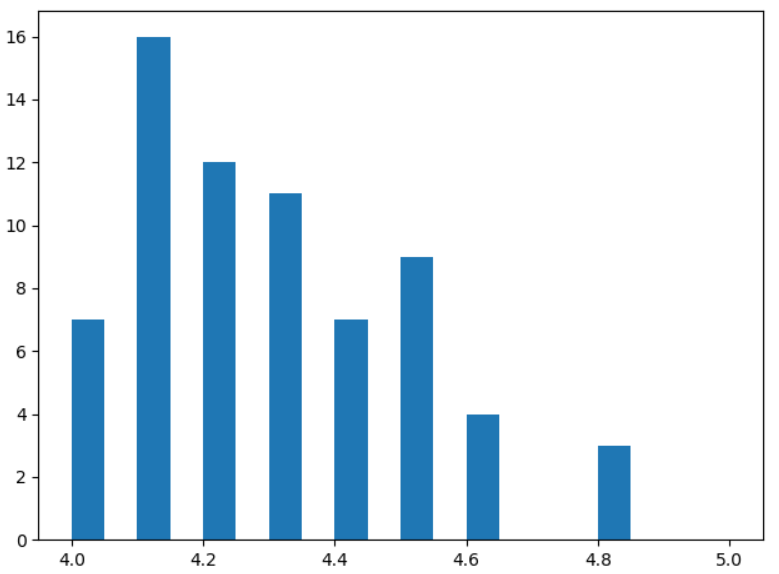
这里的 bins=20 是指定直方图直方的个数为20个,range(4,5)指定范围在4到5之间的。
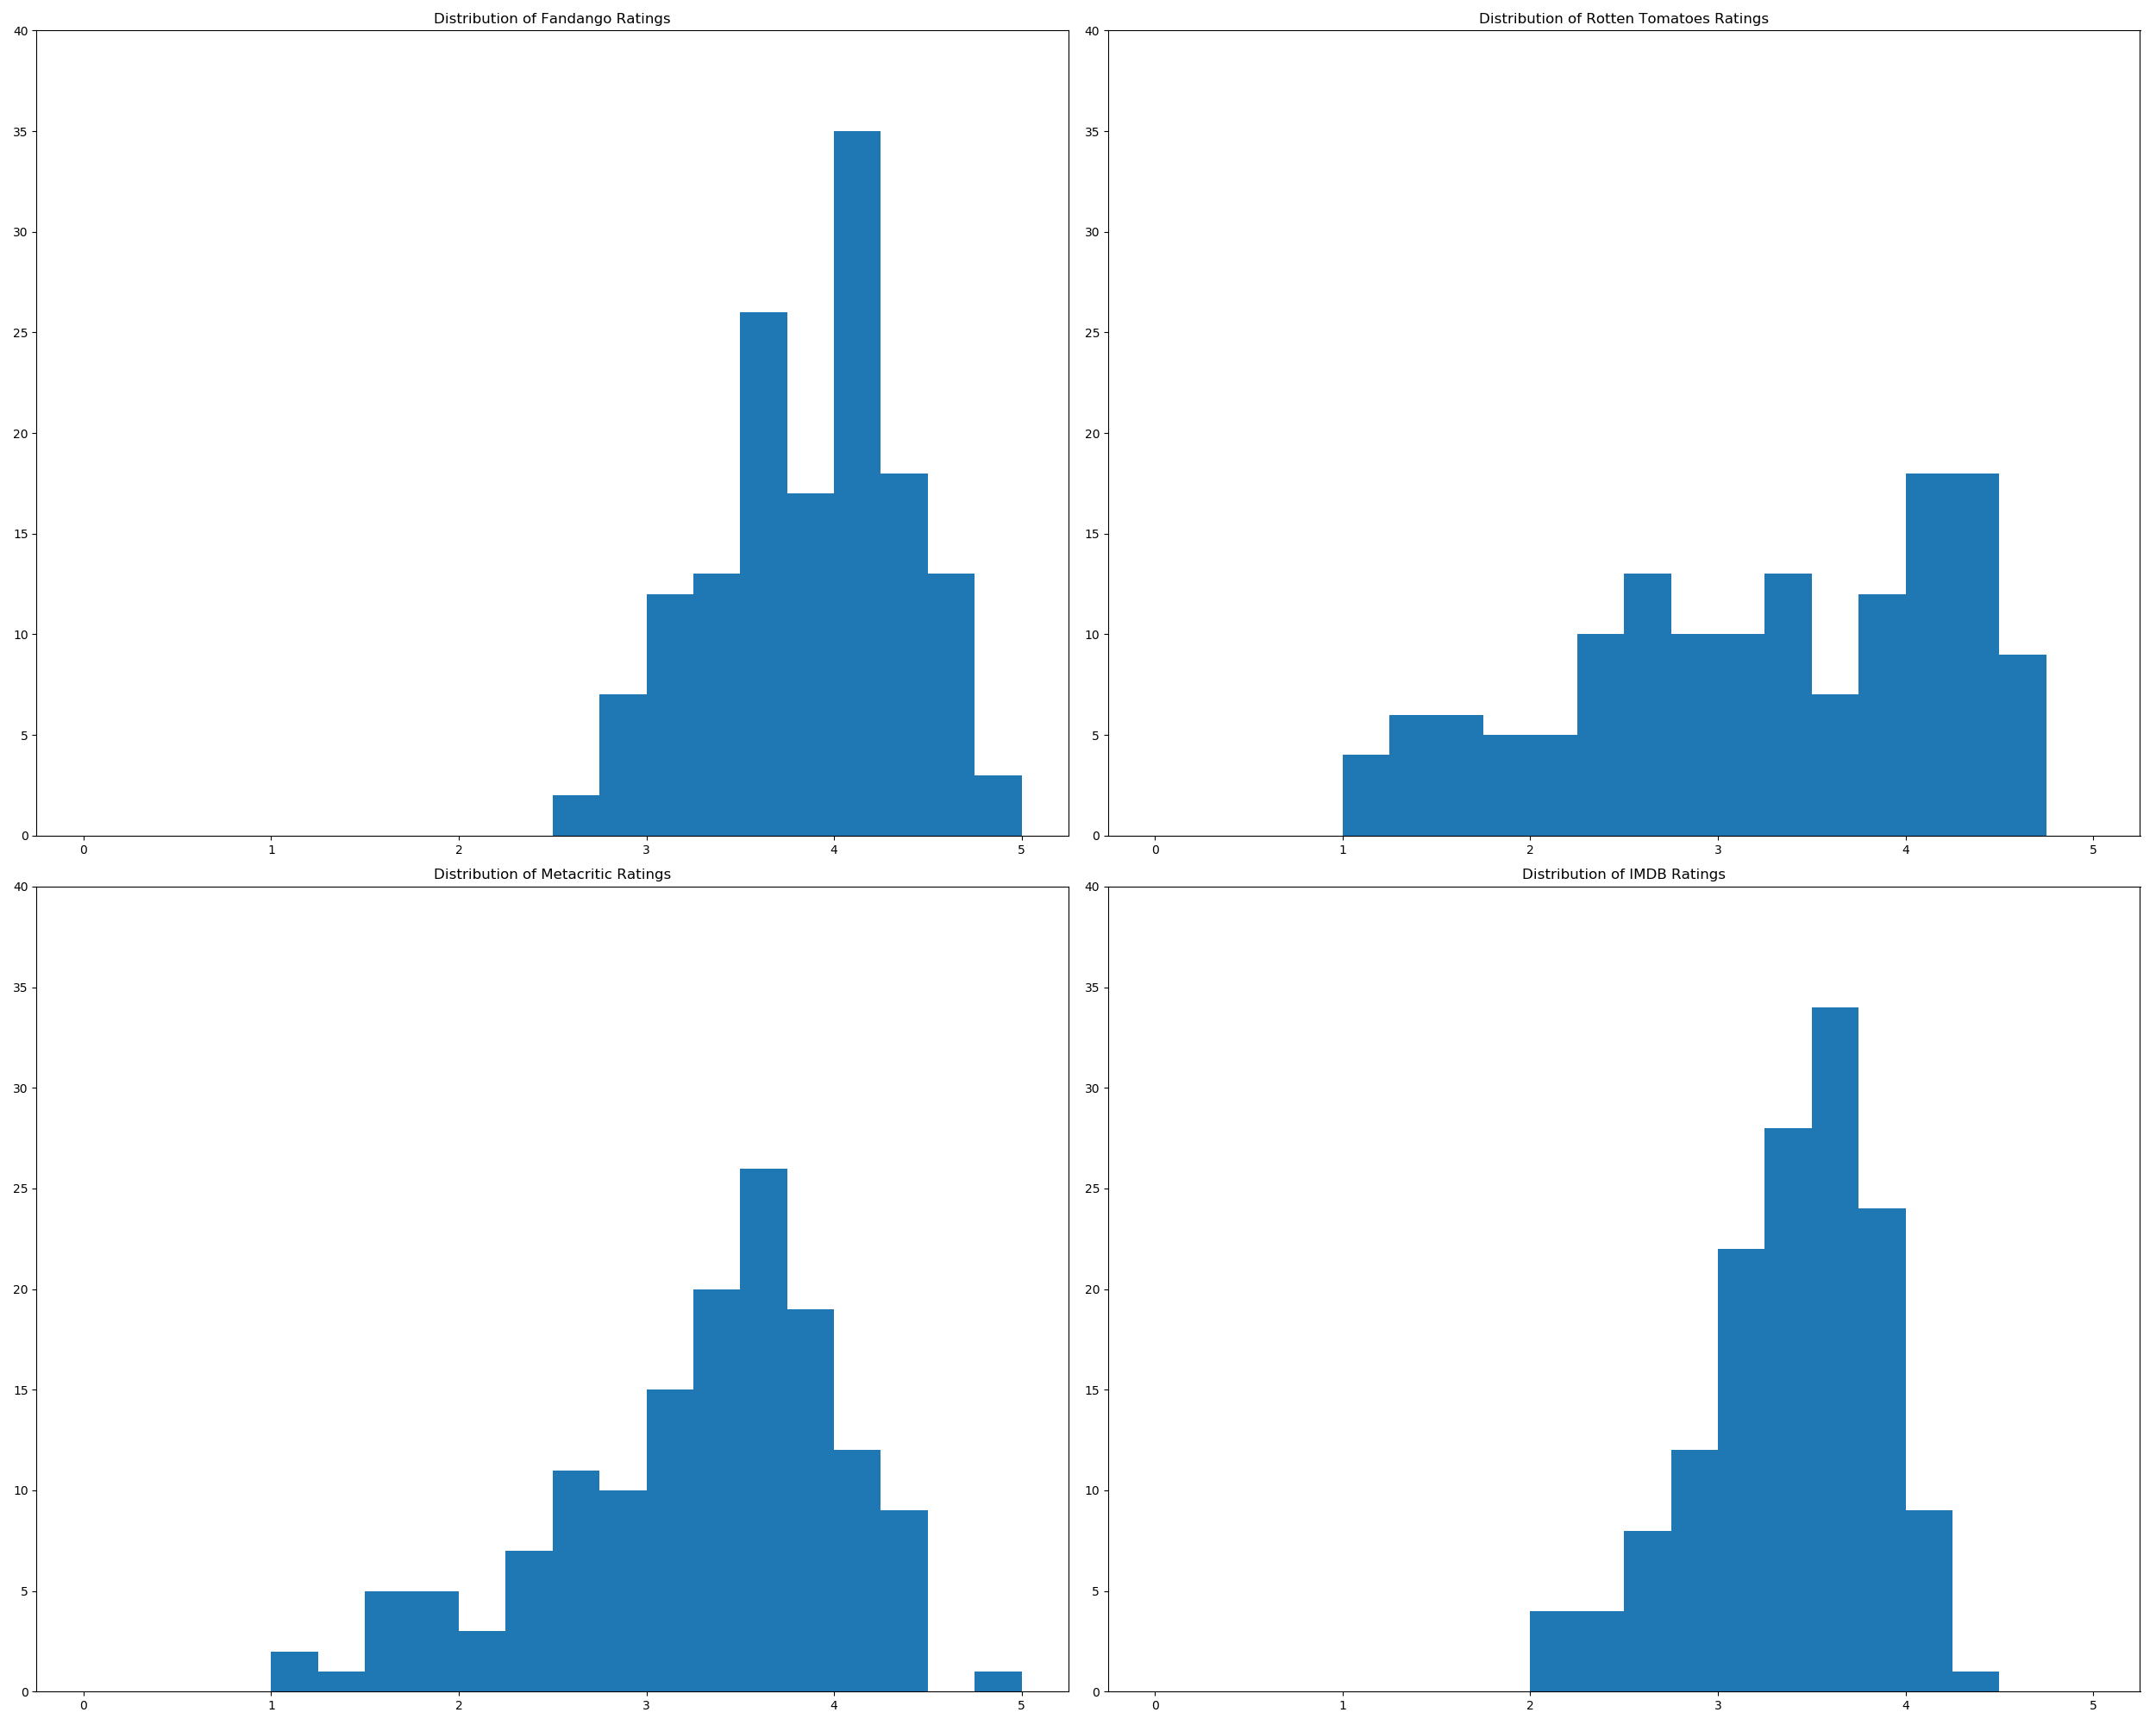
绘制直方图子图:
 1 fig = plt.figure(figsize=(25, 20))
 2 ax1 = fig.add_subplot(2, 2, 1)
 3 ax2 = fig.add_subplot(2, 2, 2)
 4 ax3 = fig.add_subplot(2, 2, 3)
 5 ax4 = fig.add_subplot(2, 2, 4)
 6 ax1.hist(norm_reviews['Fandango_Ratingvalue'], bins=20, range=(0, 5))
 7 ax1.set_title('Distribution of Fandango Ratings')
 8 ax1.set_ylim(0, 40)
 9
10 ax2.hist(norm_reviews['RT_user_norm'], 20, range=(0, 5))
11 ax2.set_title('Distribution of Rotten Tomatoes Ratings')
12 ax2.set_ylim(0, 40)
13
14 ax3.hist(norm_reviews['Metacritic_user_nom'], 20, range=(0, 5))
15 ax3.set_title('Distribution of Metacritic Ratings')
16 ax3.set_ylim(0, 40)
17
18 ax4.hist(norm_reviews['IMDB_norm'], 20, range=(0, 5))
19 ax4.set_title('Distribution of IMDB Ratings')
20 ax4.set_ylim(0, 40)
21
22 plt.show()
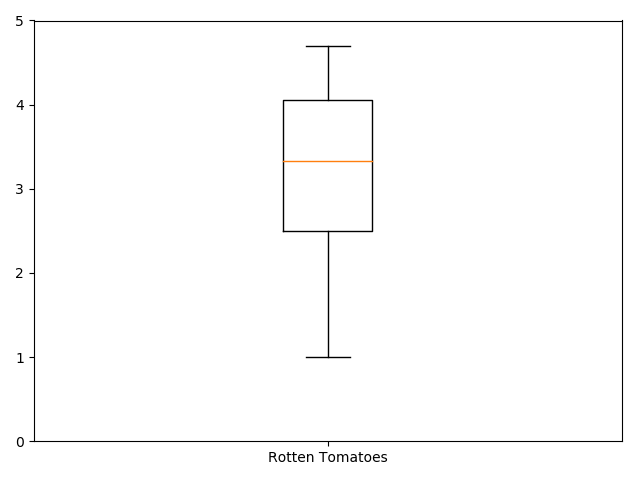
绘制箱线图
绘制箱线图可以使用 ax.boxplot() 来绘制。
1 fig, ax = plt.subplots()
2 ax.boxplot(norm_reviews['RT_user_norm'])
3 ax.set_xticklabels(['Rotten Tomatoes'])
4 ax.set_ylim(0, 5)
5 plt.show()
运行结果:
绘制多个箱线图:
1 num_cols = ['RT_user_norm', 'Metacritic_user_nom', 'IMDB_norm', 'Fandango_Ratingvalue']
2 fig, ax = plt.subplots()
3 ax.boxplot(norm_reviews[num_cols].values)   #箱线图
4 ax.set_xticklabels(num_cols, rotation=20)
5 ax.set_ylim(0,5)
6 plt.show()
运行结果:

隐藏边框
隐藏上边框和右边框
 1 women_degrees = pd.read_csv('matplotlib_data_testpercent-bachelors-degrees-women-usa.csv')
 2 fig, ax = plt.subplots()
 3 ax.plot(women_degrees['Year'], women_degrees['Biology'], c='blue', label='Women')
 4 ax.plot(women_degrees['Year'], 100-women_degrees['Biology'], c='green', label='Men')
 5 ax.tick_params(bottom="off", top="off", left="off", right="off") # 设置刻度线是否显示
 6 print(type(ax.spines))
 7 # 取消边框
 8 for key, spine in ax.spines.items():
 9     # 'left', 'right', 'bottom', 'top'
10     if key == 'right' or key == 'top':
11         spine.set_visible(False)
12
13
14 ax.legend(loc='upper right')
15 plt.show()
运行结果:
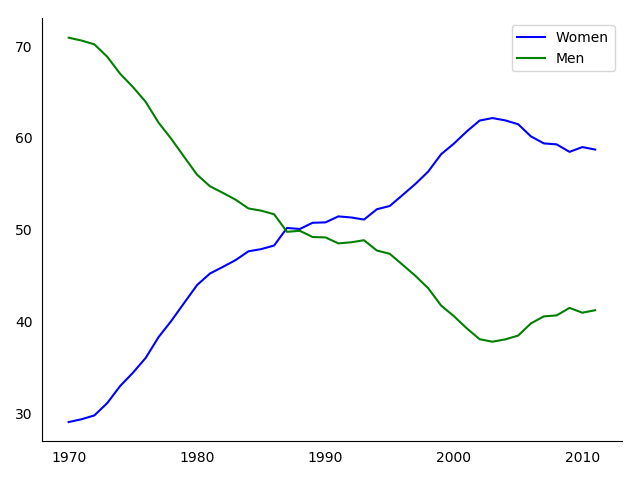
在上面的代码中,我们可以发现第五行可以实现坐标轴上的刻度是否显示,以及显示在哪个边框。
绘制无边框的折线子图
 1 women_degrees = pd.read_csv('matplotlib_data_testpercent-bachelors-degrees-women-usa.csv')
 2 major_cats = ['Biology', 'Computer Science', 'Engineering', 'Math and Statistics']
 3
 4 # 设置线的颜色
 5 cb_dark_blue = (0 / 255, 107 / 255, 164 / 255)
 6 cb_orange = (255 / 255, 128 / 255, 14 / 255)
 7
 8 fig = plt.figure(figsize=(12, 12))
 9
10 for sp in range(0, 4):
11     ax = fig.add_subplot(2, 2, sp + 1)
12     # The color for each line is assigned here.
13     ax.plot(women_degrees['Year'], women_degrees[major_cats[sp]], c=cb_dark_blue, label='Women')
14     ax.plot(women_degrees['Year'], 100 - women_degrees[major_cats[sp]], c=cb_orange, label='Men')
15     for key, spine in ax.spines.items():
16         spine.set_visible(False)
17     ax.set_xlim(1968, 2011)
18     ax.set_ylim(0, 100)
19     ax.set_title(major_cats[sp])
20     ax.tick_params(bottom="off", top="off", left="off", right="off")
21     plt.legend(loc='best')
22
23 plt.show()
运行结果:

这里你可以使用 linewidth=10 来指定线的宽度。