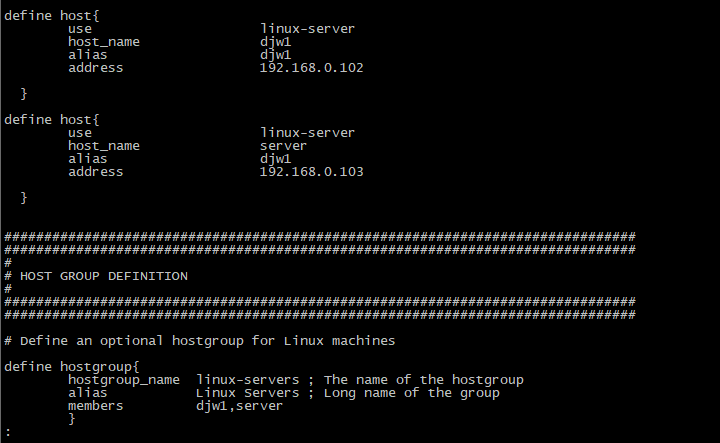
[root@nagios etc]# cat objects/hosts.cfg
use linux-server ---object下的模板 templates.cfg 里的变量定义
host_name djw1
alias djw1
address 192.168.0.102
use linux-server
host_name server
alias djw1
address 192.168.0.103
hostgroup_name linux-servers ; The name of the hostgroup
alias Linux Servers ; Long name of the group
members djw1,server
}
2.检查语法:
/etc/init.d/nagios checkconfig
报错:Error: There are no services defined!
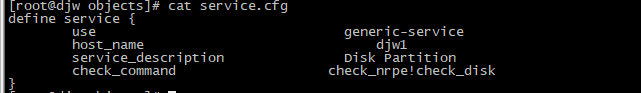
3.配置service.cfg配置文件
[root@nagios etc]# cat objects/service.cfg
define service {
use generic-service
host_name djw1
service_description Disk Partition
check_command check_nrpe!check_disk
}
3.再次检查语法:
/etc/init.d/nagios checkconfig
报错:Error: Service check command 'check_nrpe' specified in service 'Disk Partition' for host 'djw1' not defined anywhere! (表示命令check_nrpe不存在)
4. 在/usr/local/nagios/etc/objects/command.cfg 添加命令
define command{
command_name check_nrpe
command_line $USER1$/check_nrpe -H $HOSTADDRESS$ -c $ARG1$ (等价于/usr/local/nagios/libexec/check_nrpe -H 192.168.161.135 -c check_disk)
}
5. 重启nagios
/etc/init.d/nagios checkconfig --再次检查语法,没有报错
/etc/init.d/nagios reload --平滑重启
6.注意nagios oldboy用户访问权限
sed -i 's#nagiosadmin#oldboy#g' /usr/local/nagios/etc/cgi.cfg
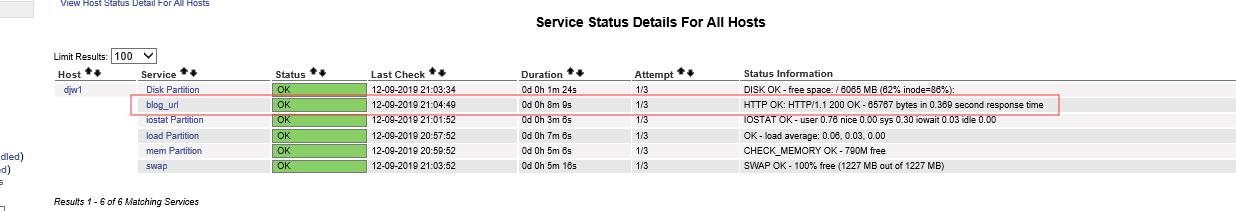
7.查看结果

8.被动监控结果:(都是调用check_nrpe监控的监控)
check_nrpe!check_disk的原理就是下面的命令:(客户端的磁盘)
[root@djw etc]# /usr/local/nagios/libexec/check_nrpe -H 192.168.0.102 -c check_disk
DISK OK - free space: / 6065 MB (62% inode=86%);| /=3668MB;8209;9441;0;10262
9.增加从nagios服务器端发起的监控:如url地址,端口(check_tcp)
在配置目录etc下的servers目录增加文件abc.cfg文件:
define service{
use generic-service
host_name djw1
service_description blog_url
check_command check_weburl!-I 192.168.0.104
max_check_attempts 3
normal_check_interval 2
retry_check_interval 1
check_period 24x7
notification_interval 30
notification_period 24x7
notification_options w,u,c,r
contact_groups admins
}
command.cfg文件下:
# 'check_weburl' command definition
define command{
command_name check_weburl
command_line $USER1$/check_http $ARG1$ -w 10 -c 30
}
检查、启动:
/etc/init.d/nagios checkconfig
/etc/init.d/nagios reload
打开服务端nrpe:
/usr/local/nagios/bin/nrpe -c /usr/local/nagios/etc/nrpe.cfg
结果:
小结:一般客户端对外开启的服务,用主动模式监控,例如:port ,url。
主动模式的监控配置过程:
1)在服务端的命令行把要监控的命令先调试好。
2)在commands.cfg里定义nagios命令,同时调用命令行的插件
3)在服务的配置文件里定义要监控的服务,调用commands.cfg里定义nagios的监控命令。
10.nagios监控各个文件之间的关系
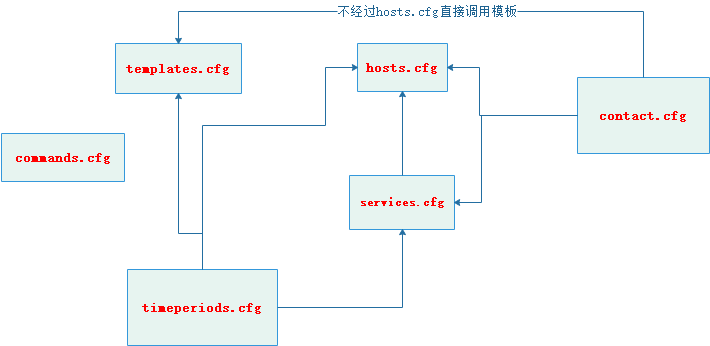
commands.cfg会被各个文件进行调用。