Clustering is an excellent technique for visualizing lotss of point data. We've all seen applications where there were so many points that simply appear as one big blob.Clustering takes the individual points and groups them into clusters and then renders the cluster as one graphic.In this post I will describe how you can use ArcGIS API for Flex to create clustering demo.
First,I add 500 random points in the map of tianditu.(There tell you how to create tianditu use ArcGIS API for Flex)
       // 往地图上添加点
            protected function addPointsToMap(cluseter:WeightedClusterer):void
            {
                var graphicsLayer:GraphicsLayer = new GraphicsLayer();

                for(var i:int = 0; i < 500; i++)
                {
                    // 产生随机数
                    var num: Number = Math.round(Math.random() * 500);
                    var num2: Number = Math.round(Math.random() * 500);

                    // 产生随机颜色
                    var index: Number = Math.round(Math.random() * 5);
                    var colors: Array = ["0xFF00FF", "0x0000FF", "0x000000", "0x008000", "0x800000"];
                    var color:Number = parseInt(colors[index]);

                    var sym:SimpleMarkerSymbol = new SimpleMarkerSymbol("circle",15,color);

                    var geo:MapPoint = new MapPoint(120.13102 - num * 0.01, 30.19089 - num2 * 0.01);
                    var graphic:Graphic = new Graphic(geo,sym);
                    graphicsLayer.add(graphic);

                }

                myMap.addLayer(graphicsLayer);
            }
And then, I create the Cluster.
          // 文本格式
                var tf:TextFormat = new TextFormat("Arial",14,0xE6E6E6);

                // 创建FlareSymbol
                var flareSymbol:FlareSymbol = new FlareSymbol();
                flareSymbol.backgroundAlphas = [0.7,1.0];
                flareSymbol.backgroundColor = 0x394B8C;
                flareSymbol.backgroundColors = [0x5B8C3E,0xBF2827];
                flareSymbol.borderColor= 0x666666;
                flareSymbol.flareMaxCount=30;
                flareSymbol.flareSizeIncOnRollOver=3;
                flareSymbol.sizes=[20,30];
                flareSymbol.textFormat=tf;
                flareSymbol.weights=[30,60];

                // 创建Clustering
                var cluseter:WeightedClusterer = new WeightedClusterer();
                cluseter.sizeInPixels = 20;
                cluseter.symbol = flareSymbol;
                cluseter.center = new MapPoint(117.02263, 28.28375,new SpatialReference(4490));
At last, add cluseter to graphic.
graphicsLayer.clusterer = cluseter;
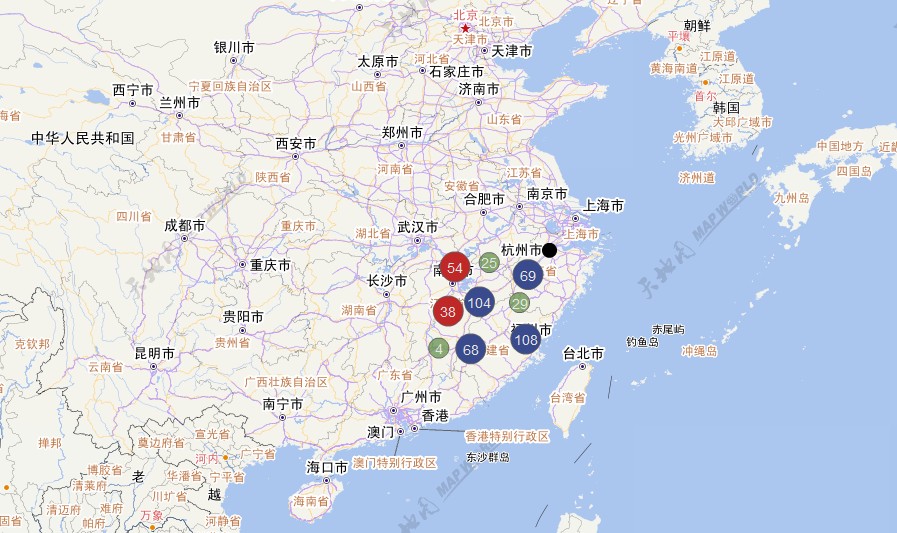
The effect is like it.
Download source here.