
示例代码托管在:http://www.github.com/dashnowords/blogs
博客园地址:《大史住在大前端》原创博文目录
华为云社区地址:【你要的前端打怪升级指南】
一. 任务说明
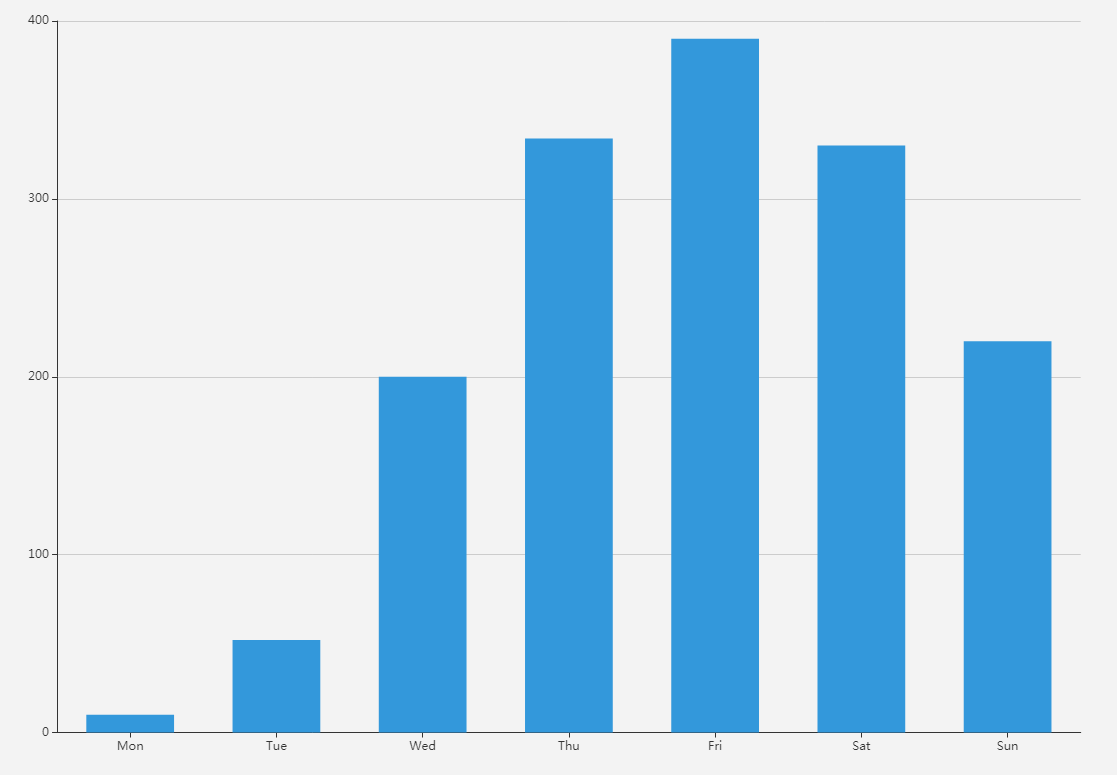
使用原生canvasAPI绘制柱状图。(柱状图截图来自于百度Echarts官方示例库【查看示例链接】)
二. 重点提示
柱状图或许是最容易实现的图表类型了,矩形的部分直接使用fillRect()来绘制即可,为了将坐标轴标签文字绘制在小分割线中间,需要用measureText()来测量文本的宽度,然后进行相应的偏移,否则直接绘制的话文字的左边界会和直线相对齐。其他部分都是一些基本API的使用,希望各位小伙伴通过做练习来熟悉这些API的用法。
三. 示例代码
提示:代码中将个别图表参数直接写在了函数里(也就是所谓的“魔鬼数字”),这种做法是不提倡的,因为它违反了开发的基本原则之一“开放封闭原则”。如果你使用过Echarts图表库就会发现,图表中几乎所有要素都可以通过参数来定制,此处只需要关注canvasAPI的实现方法即可。
/**
* 获取canvas绘图上下文
* @type {[type]}
*/
const canvas = document.getElementById('canvas');
const context = canvas.getContext('2d');
//绘图配置
let options = {
chartZone:[50,50,1000,700],//标识绘图区域
yAxisLabel:['0','100','200','300','400'],//标示Y轴坐标
yMax:400,//Y轴最大值
xAxisLabel:['Mon','Tue','Wed','Thu','Fri','Sat','Sun'],//X轴坐标
data:[10,50,200,330,390,320,220],//柱状图数据
barStyle:{
70,//柱状图宽度
color:'#1abc9c'//柱状图颜色
}
}
/*Echarts使用时,会调用实例方法echartsInstance.setOptions(options)来启动绘图*/
drawBarChart(options);
/**
* 绘制柱状图
*/
function drawBarChart(options) {
drawAxis(options); //绘制坐标轴
drawYLabels(options); //绘制y轴坐标
drawXLabels(options); //绘制x轴坐标
//drawData(options);//绘制柱状图
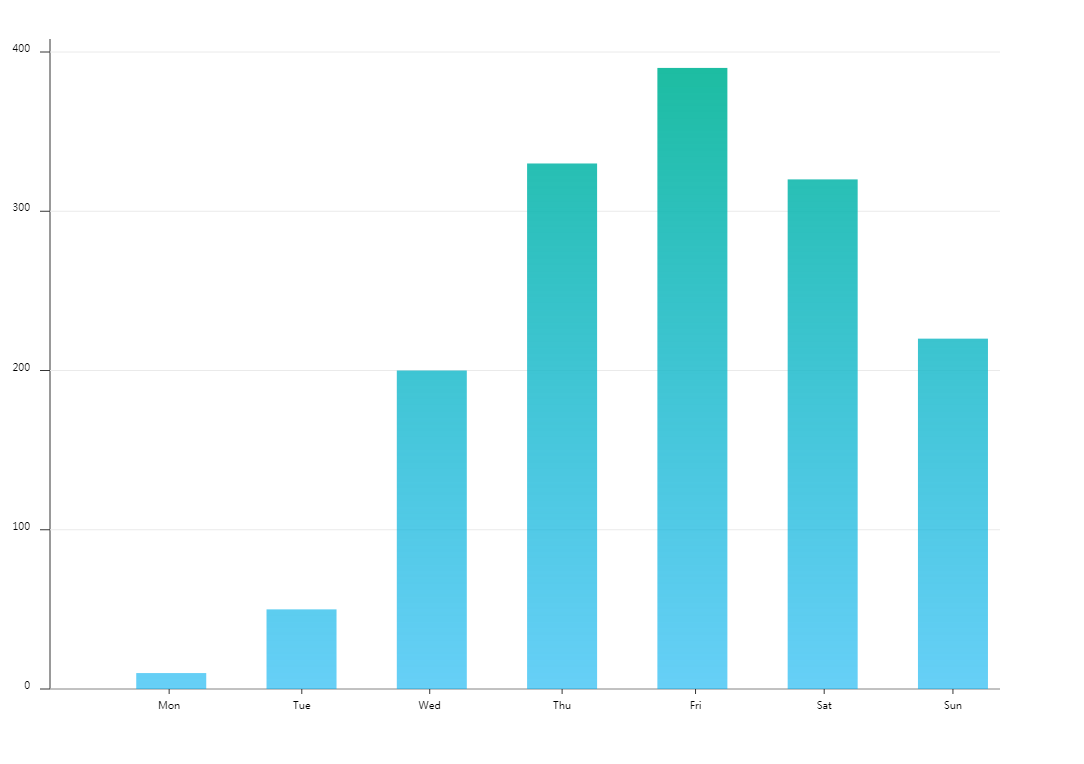
drawDataGradient(options);//绘制渐变色柱状图
}
/**
* 绘制坐标轴
*/
function drawAxis(options) {
let chartZone = options.chartZone;
context.strokeWidth = 4;
context.strokeStyle = '#353535';
context.moveTo(chartZone[0],chartZone[1]);
context.lineTo(chartZone[0],chartZone[3]); //y轴总高从50到700
context.lineTo(chartZone[2],chartZone[3]); //x轴总长从50到1000
context.stroke();
}
/**
* 绘制y轴坐标
*/
function drawYLabels(options) {
let labels = options.yAxisLabel;
let yLength = (options.chartZone[3] - options.chartZone[1])*0.98;
let gap = yLength / (labels.length - 1);
labels.forEach(function (label, index) {
//绘制坐标文字
let offset = context.measureText(label).width + 20;
context.strokeStyle = '#eaeaea';
context.font = '16px';
context.fillText(label, options.chartZone[0] - offset ,options.chartZone[3] - index * gap);
//绘制小间隔
context.beginPath();
context.strokeStyle = '#353535';
context.moveTo(options.chartZone[0] - 10, options.chartZone[3] - index * gap);
context.lineTo(options.chartZone[0], options.chartZone[3] - index * gap);
context.stroke();
//绘制辅助线
context.beginPath();
context.strokeStyle = '#eaeaea';
context.strokeWidth = 2;
context.moveTo(options.chartZone[0], options.chartZone[3] - index * gap);
context.lineTo(options.chartZone[2], options.chartZone[3] - index * gap);
context.stroke();
});
}
/**
* 绘制x轴坐标
*/
function drawXLabels(options) {
let labels = options.xAxisLabel;
let xLength = (options.chartZone[2] - options.chartZone[0])*0.96;
let gap = xLength / labels.length;
labels.forEach(function (label, index) {
//绘制坐标文字
let offset = context.measureText(label).width;
context.strokeStyle = '#eaeaea';
context.font = '18px';
context.fillText(label, options.chartZone[0] + (index + 1) * gap - offset ,options.chartZone[3] + 20);
//绘制小间隔
context.beginPath();
context.strokeStyle = '#353535';
context.moveTo(options.chartZone[0] + (index + 1) * gap - offset / 2 ,options.chartZone[3]);
context.lineTo(options.chartZone[0] + (index + 1) * gap - offset / 2,options.chartZone[3]+5);
context.stroke();
//存储偏移量
options.offsetXLabel = offset / 2;
});
}
/**
* 绘制数据
*/
function drawData(options) {
let data = options.data;
let xLength = (options.chartZone[2] - options.chartZone[0])*0.96;
let yLength = (options.chartZone[3] - options.chartZone[1])*0.98;
let gap = xLength / options.xAxisLabel.length;
//绘制矩形
data.forEach(function (item, index) {
context.fillStyle = options.barStyle.color || '#1abc9c'; //02BAD4
let x0 = options.chartZone[0] + (index + 1) * gap - options.barStyle.width / 2 - options.offsetXLabel;
let height = item / options.yMax * (options.chartZone[3] - options.chartZone[1])*0.98;
let y0 = options.chartZone[3] - height;
let width = options.barStyle.width;
context.fillRect(x0,y0,width,height);
});
}
/**
* 绘制线性渐变色柱状图
*/
function drawDataGradient(options) {
let data = options.data;
let xLength = (options.chartZone[2] - options.chartZone[0])*0.96;
let yLength = (options.chartZone[3] - options.chartZone[1])*0.98;
let gap = xLength / options.xAxisLabel.length;
//创建渐变色
let fillStyleGradient = context.createLinearGradient(50,50,50,700);
fillStyleGradient.addColorStop(0, options.barStyle.color);
fillStyleGradient.addColorStop(1, 'rgba(1,176,241,0.6)');
//绘制矩形
data.forEach(function (item, index) {
context.fillStyle = fillStyleGradient;
let x0 = options.chartZone[0] + (index + 1) * gap - options.barStyle.width / 2 - options.offsetXLabel;
let height = item / options.yMax * (options.chartZone[3] - options.chartZone[1])*0.98;
let y0 = options.chartZone[3] - height;
let width = options.barStyle.width;
context.fillRect(x0,y0,width,height);
});
}
浏览器中可查看效果:
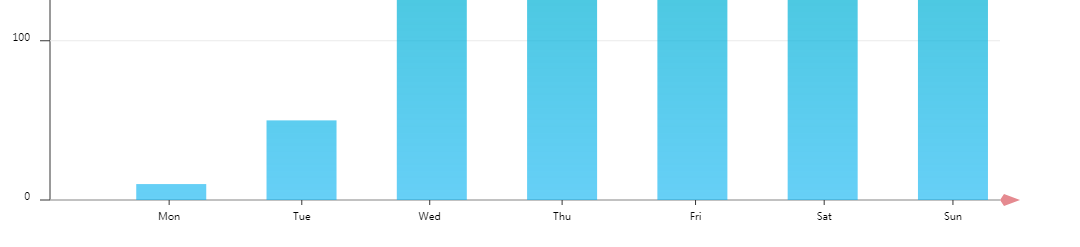
四. 思考题
如果希望在坐标轴末端加一个箭头,需要怎么做呢?
/*x轴箭头示例*/
//1.options中增加箭头颜色和大小的设置
let options = {
    //...
    axisArrow:{
            size:2,
            color:'#DA5961'
        }
}
//箭头绘制函数

/**
 * x轴绘制箭头
 */
function drawArrow(options) {
    let factor = options.axisArrow.size;//获取箭头大小因子
    context.save();//保存当前设置的绘图上下文
    context.translate(options.chartZone[2], options.chartZone[3]);//移动坐标系原点至x轴末端
    context.beginPath();//开始绘制箭头
    context.moveTo(0,0);//移动至新原点
    context.lineTo(2 * factor,-3 * factor);
    context.lineTo(10 * factor,0);
    context.lineTo(2 * factor, 3 * factor);
    context.lineTo(0,0);
    context.globalAlpha = 0.7; //设置填充色透明度
    context.fillStyle = options.axisArrow.color;//获取箭头颜色
    context.fill();//填充箭头路径
    context.restore();//恢复绘图上下文样式设置
}
箭头效果:
y轴的箭头请自行完成即可。