Aspose.Cells可以预先定义Excel模板,然后填充数据(官方文档:http://www.aspose.com/docs/display/cellsjava/Smart+Markers)。
设置的模板是一个标准的Excel文件,包含了可视化的格式,公式,以及标记(smart markers),并且可以引用多个数据源。
支持的标记(Smart Marker Options)
&=DataSource.FieldName 数据元是ICellsDataTable或者是JavaBean
&=[Data Source].[Field Name] 数据源是 ResultSet
&=$VariableName 一个变量
&=$VariableArray 数组变量
&==DynamicFormula 暂时不清楚
&=&=RepeatDynamicFormula 动态计算
下面介绍这两种标记的使用方式
1、&=$VariableName 一个变量
2、&=$VariableArray 数组变量

Java代码
     String path = "SmartMarkerDesigner.xls";
        InputStream inputStream = ClassLoader.getSystemResourceAsStream(path);
        Workbook wb = new Workbook(inputStream);
        WorkbookDesigner designer = new WorkbookDesigner();
        designer.setWorkbook(wb);
        designer.setDataSource("Variable", "Single Variable");
        designer.setDataSource("MultiVariable", new String[]
        {
                "Variable 1", "Variable 2", "Variable 3"
        });
        designer.setDataSource("MultiVariable2", new String[]
        {
                "Skip 1", "Skip 2", "Skip 3"
        });
        designer.setDataSource("Array1Dim", new String[]
        {
                "A1", "A2", "A3"
        });
        designer.setDataSource("Array2Dim", new String[][]
        {
                {
                        "A11", "A12", "A13"
                },
                {
                        "A21", "A22", "A23", "A24"
                },
                {
                        "A31", "A32",
                },
        });

下面介绍JavaBean的使用方式
&=DataSource.FieldName 数据元是ICellsDataTable或者是JavaBean
&=Person.name(bean) 注意这个地方需要加上bean

其中&=&=C{r}*D{r} 是动态计算的标记
&=&= 构面跟一个表达式 r代表当前行,C{r}*D{r} 这样在循环的时候没一行都会计算。
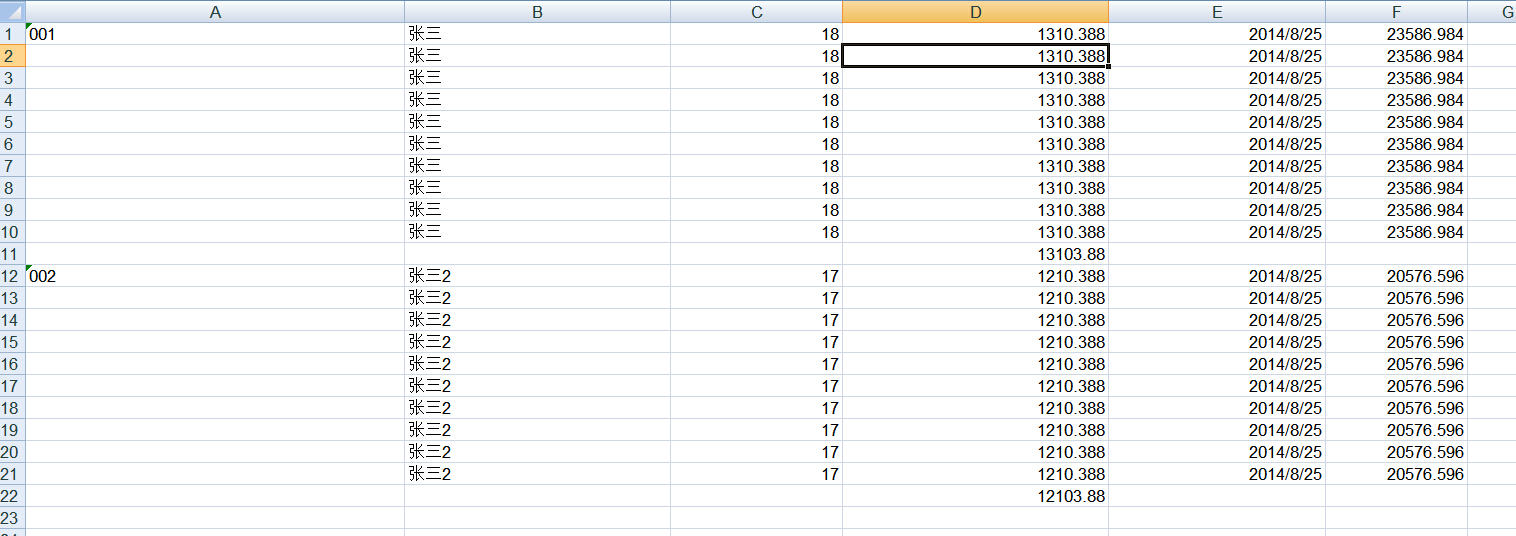
上面的例子用id这列进行分组Grouping Data
normal - The group by field(s) value is not be repeated for the corresponding records in the column; instead they are printed once per data group.
分组的列不会被循环输出,只会输出一次。
merge - The same behavior as for the normal parameter, except that it merges the cells in the group by field(s) for each group set.
和normal一样,但是他会合并单元格
repeat - The group by field(s) value is repeated for the corresponding records.
分组的列会循环输出
&=subtotal9:Person.id 放在那一列下面是按照id进行分组统计。

或者&=Employee.money(subtotal9:Employee.id) 这么写也行,按照id进行分组统计


subtotalN (N的值可以是1-11 平均数 总行数 最大值 最小值 总和 等等。)
Performs a summary operation for a specified field data related to a group by field. The N represents numbers between 1 and 11 which specify the function used when calculating subtotals within a list of data. (1=AVERAGE, 2=COUNT, 3=COUNTA, 4=MAX, 5=MIN,...9=SUM etc.) Refer to the Subtotal reference in Microsoft Excel's help for further details.
The format actually states as:
subtotalN:Ref where Ref refers to the group by column.
&=Products.Units(subtotal9:Products.ProductID) specifies summary function upon Units field with respect to the ProductID field in the Products table.
&=Tabx.Col3(subtotal9:Tabx.Col1) specifies summary function upon the Col3 field group by Col1 in the table Tabx.
&=Table1.ColumnD(subtotal9:Table1.ColumnA&Table1.ColumnB) specifies summary function upon ColumnD field group by ColumnA and ColumnB in the table Table1.