目录
一、ElK环境搭建
    1.1.elasticsearch
    1.2.kibana
    1.3.logstash
二、elk实践
    2.1 使用elk分析nginx日志
一、ElK环境搭建
1.1 elasticsearch
下载的地址如下,我们这里下载2.4.6版本,我们kibana后面用的是4.x的,对应的是2.x版本
https://www.elastic.co/blog/elasticsearch-5-5-1-and-2-4-6-released
如果想下载6.x版本,建议到你要安装的目录下执行,会下载在该目录下,我这里下载到opt的elk目录下,
cd /opt/elk
wget https://artifacts.elastic.co/downloads/elasticsearch/elasticsearch-6.2.4.tar.gz
改名字
 tar zxvf elasticsearch-6.2.4.tar.gz (按下载的版本改)
 mv elasticsearch-6.2.4 elasticsearch
添加用户组与用户,设置用户的组名和密码,useradd elasticsearch(用户名) -g elasticsearch(组名) -p elasticsearch(密码)
groupadd elasticsearch
useradd  elasticsearch -g elasticsearch -p elasticsearch
我们刚刚不是改目录为elasticsearch嘛,现在去到那个目录授权,我的目录在/opt/elk/elasticsearch,所以应该先去/opt/elk下面
cd /opt/elk
chown -R elasticsearch:elasticsearch elasticsearch
到目前为止,我们都是在root用户进行的,启动命令是./bin/elasticsearch,但是用root启动会报错,因为他不允许在root用户下面启动。
所以这个时候我们进入用户,输入刚刚设置好的密码
su elasticsearch
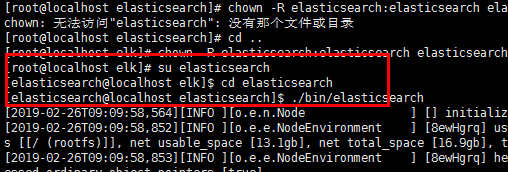
最后我们去目录下启动
./bin/elasticsearch
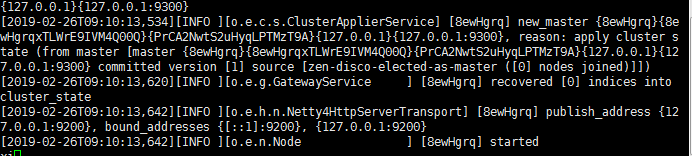
看到这样的就是成功了
当然了,我们都喜欢它在后台启动
./bin/elasticsearch -d
我们需要配置ip,这样才可以访问。跳转到Elasticsearch的config配置文件下,使用vim打开elasticsearch.yml,找到里面的"network.host",将其改为你ifconfig查询得到的IP,保存。
 cd elasticsearch/config/

 vi elasticsearch.yml
配置完我们需要重启,好的,然后elasticsearch最坑爹的一点来了,这个东西没有重启命令!!!只能ps -ef| grep查进程然后杀掉重新开,集群采用滚动重启。
ps -ef | grep elastic
kill -9 你的进程
到这里你可能还会发现这货是没有关闭命令的。
好的,跑起来。。emm?
ERROR: [3] bootstrap checks failed
[1]: max file descriptors [4096] for elasticsearch process is too low, increase to at least [65536]
[2]: max number of threads [3818] for user [elasticsearch] is too low, increase to at least [4096]
[3]: max virtual memory areas vm.max_map_count [65530] is too low, increase to at least [262144]
[2019-02-26T09:46:32,000][INFO ][o.e.n.Node               ] [8ewHgrq] stopping ...
[2019-02-26T09:46:32,025][INFO ][o.e.n.Node               ] [8ewHgrq] stopped
[2019-02-26T09:46:32,026][INFO ][o.e.n.Node               ] [8ewHgrq] closing ...
[2019-02-26T09:46:32,113][INFO ][o.e.n.Node               ] [8ewHgrq] closed
解决它,我们先退回root(用exit退出当前用户)用户,来改点东西
1、max file descriptors [4096] for elasticsearch process is too low, increase to at least [65536]

  每个进程最大同时打开文件数太小,可通过下面2个命令查看当前数量

ulimit -Hn
ulimit -Sn
  修改/etc/security/limits.conf文件,增加配置,用户退出后重新登录生效,配置完别急着退出这个文件,下面还要接着插入指令

*               soft    nofile          65536
*               hard    nofile          65536
2.max number of threads [3818] for user [es] is too low, increase to at least [4096]
问题同上,最大线程个数太低。修改配置文件/etc/security/limits.conf,增加配置
|
1
2
|
* soft nproc 4096* hard nproc 4096 |
可通过命令查看
ulimit -Hu
ulimit -Su
3、max virtual memory areas vm.max_map_count [65530] is too low, increase to at least [262144]
修改/etc/sysctl.conf文件,增加配置vm.max_map_count=262144
vi /etc/sysctl.conf
sysctl -p
执行命令sysctl -p生效
现在我们访问centos服务器的9200端口

终于能正常访问了。但是好 j。。b丑啊。一堆json。
1.2.kibana
1.2.1. 创建kibana.repo
$ sudo vi /etc/yum.repos.d/kibana.repo
[kibana-4.4]
name=Kibana repository for 4.4.x packages
baseurl=http://packages.elastic.co/kibana/4.4/centos
gpgcheck=1
gpgkey=http://packages.elastic.co/GPG-KEY-elasticsearch
enabled=1
1.2.2. 使用yum install安装kibana
你要先指定一下你的路径再yum install
$ cd /opt
$ sudo yum -y install kibana
注:
1、Kibana默认端口为5601
2、kibana默认安装在/opt/kibana目录下
3、Kibana配置文件路径为/opt/kibana/config/kibana.yml
$ rpm -qc kibana
/opt/kibana/config/kibana.yml
1.2.3. 修改kibana配置
$ sudo vi /opt/kibana/config/kibana.yml
server.host: "192.168.0.228"
elasticsearch.url: "http://192.168.0.228:9200"
1.2.4. 启动kibana并添加为开机自启动服务
$ sudo systemctl start kibana
$ sudo chkconfig kibana on
kibana的访问端口是5601,如果是6.4.2的elasticsearch就会出现这种问题:提示你需要2.x的
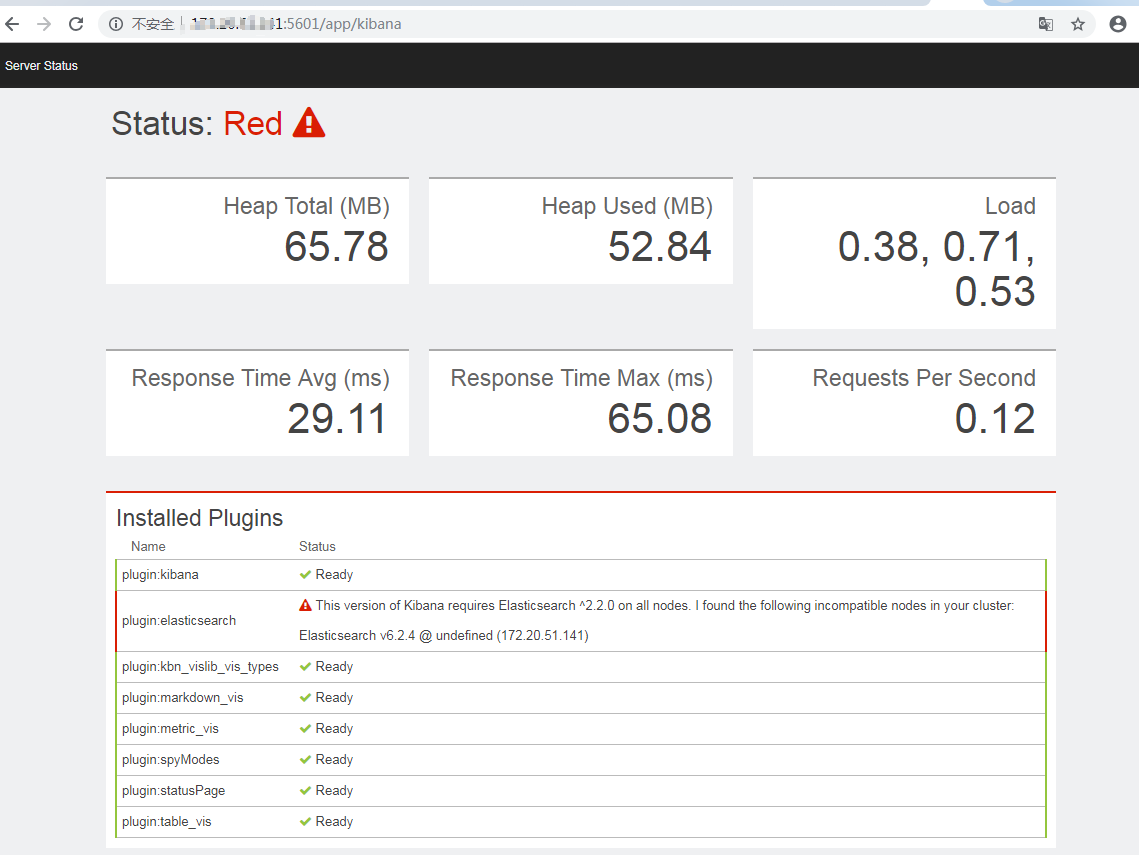
然后我改了2.x的
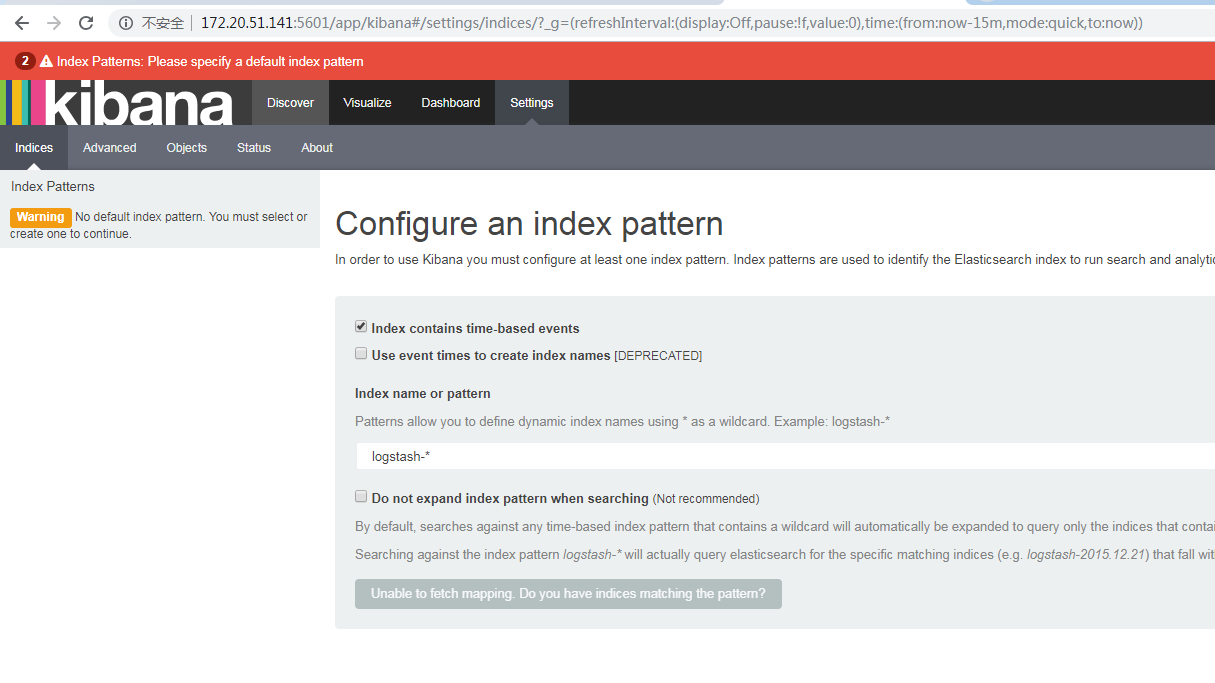
啊,好感动啊,终于出现了一个正常的界面
1.3.logstash
安装步骤
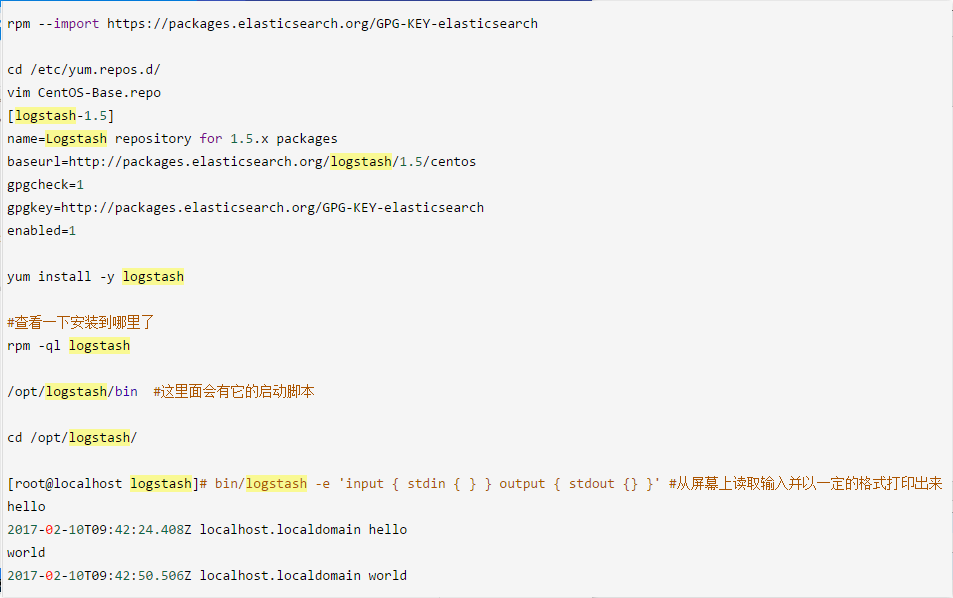
$ sudo vi /etc/yum.repos.d/logstash.repo
[logstash-2.2]
name=logstash repository for 2.2 packages
baseurl=http://packages.elasticsearch.org/logstash/2.2/centos
gpgcheck=1
gpgkey=http://packages.elasticsearch.org/GPG-KEY-elasticsearch
enabled=1


$ sudo yum -y install logstash
以下按照网友的步骤,也可以,只不过版本不同
二、elk实践
2.1.使用elk分析nginx日志
现在我们用logstash连接一下nginx的日志,我们设置acesslogs使用的类型是json,
 #在下面可以设置accesslog的参数是main还是json
    log_format  main
                      '$status $body_bytes_sent "$http_referer" '
                      '"$http_user_agent" "$http_x_forwarded_for"'

    log_format json '{"@timestamp":"$time_iso8601",'
                           '"@version":"1",'
                           '"client":"$remote_addr",'
                           '"url":"$uri",'
                           '"status":"$status",'
                           '"domain":"$host",'
                           '"host":"$server_addr",'
                           '"size":$body_bytes_sent,'
                           '"responsetime":$request_time,'
                           '"referer": "$http_referer",'
                           '"ua": "$http_user_agent"'
               '}';
    #access_log  /var/log/nginx/access.log  main;
access_log /var/log/nginx/access_json.log json;
我这边建议多开一条
access_log /var/log/nginx/access_json.log json;,不然logstash收集日志的时候可能会解析不了json,因为之前nginx会打印非json类型的日志,比如出现这样的错误
Logstash startup completed
JSON parse failure. Falling back to plain-text {:error=>#<LogStash::Json::ParserError: Invalid UTF-8 start byte 0xae
 at [Source: [B@18b40dae; line: 1, column: 3]>, :data=>":13723.230.531.124
然后的话,telnet一下自己的9200端口,看看elesticseach哪种是通的,我的只有ip:port是通的,用127.0.0.1或者localhost会报错,因为让ogstash收集nginx的日志,然后放到elasticsearch,那么配置一下,我们建立一个
log_nginx.conf的这样的一个配置文件。
hosts => ["142.20.31.921:9200"]这一句的ip按telnet的结果来搞。
vi /etc/logstash/conf.d/log_nginx.conf
input {
    file {
       path => "/var/log/nginx/access.log"
       codec => json
       start_position => "beginning"
       type => "nginx-log"
    }
}
output {if [type] == "nginx-log"{
        elasticsearch {
           hosts => ["142.20.31.921:9200"]
           index => "nginxLog-%{+YYYY.MM.dd}"
        }
}
启动logstash
/opt/logstash/bin/logstash -f /etc/logstash/conf.d/log_nginx.conf
现在是这样的

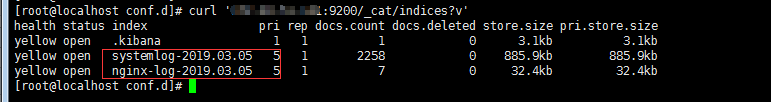
我们把数据打到elastisearch的9200上去了,索引我们设置nginxLog-%{+YYYY.MM.dd},但是我们不知道它是多少,所以我们查一下
curl 'IP:9200/_cat/indices?v'
这样我们就看到索引了。
现在去9200端口拿一下这个索引。

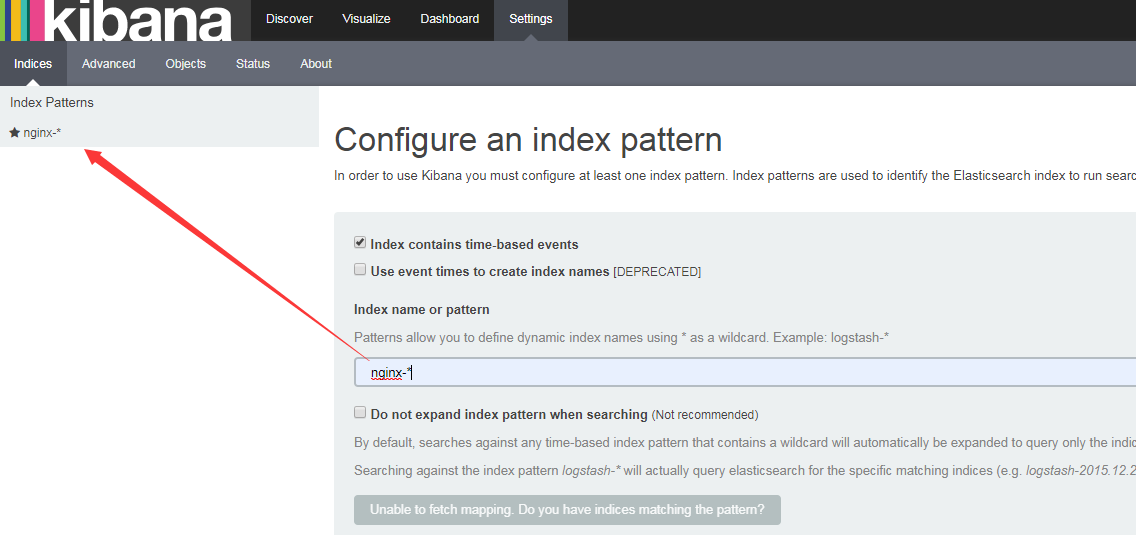
一堆json,看不清楚,上kibana,我们设置的elasticsearch以nginx-开头,搜索nginx-*即可查看。
ps:隔一段时间后启动会报错,经常会出现到kibana的bin目录下去手动启动kibana的操作。
这个时候一般找出那个扑街的进程,然后kill即可。
[root@localhost bin]# netstat -apn|grep 5601
[root@localhost bin]# sudo systemctl start kibana