今日使用小程序开发饼图页面,由于一个页面需要打印多个饼图,所以需要将echarts对象进行缓存,于是出现了如下js报错问题
一、 错误代码
VM6541:1 thirdScriptError
Converting circular structure to JSON;at setTimeout callback function
TypeError: Converting circular structure to JSON
    at JSON.stringify (<anonymous>)
    at e.exports.send (http://127.0.0.1:27264/appservice/__dev__/asdebug.js:1:1950)
    at Object.send (http://127.0.0.1:27264/appservice/__dev__/asdebug.js:1:39020)
    at Object.n [as publish] (http://127.0.0.1:27264/appservice/__dev__/asdebug.js:1:26961)
    at Object.publish (WAService.js:1:120946)
    at WAService.js:1:423146
    at w (WAService.js:1:423161)
    at Object.vdSyncBatch (WAService.js:1:1127858)
    at _ (WAService.js:1:1259999)
    at Function.<anonymous> (WAService.js:1:1260194)
why、why、why?
看过网上很多相关的错误修复方法,最后都用不上。哎坑!
最终发现是绑定echarts的问题
二、 修改前
1、 错误的report-detail.wxml 页面绑定
   <view class="echart_panel">
    <ec-canvas ec="{{ecLine}}"></ec-canvas>
  </view>
   <view class="hr"></view>
  <view class="echart_panel">
    <ec-canvas ec="{{ecLineSeason}}" ></ec-canvas>
  </view>
2、 错误的report-detail.js 数据初始化
import * as echarts from '../../../ec-canvas/echarts';
var getOptionByExternalJs = require('../../../echart-template/echart-option-config.js');
var optionConfig = new getOptionByExternalJs();
Page({
/**
* 页面的初始数据
*/
data: {
contentTxt: '平台通过存量数据导入,异构数据导入、异构系统/平台计入及互联网抓取方式,共汇集空间信息数据',
spaceNum: 23423,
stockNum: 234422,
specialNum: 347458,
internetNum: 89079,
echarts_obj_catch: '', //将数据缓存到data
echarts_obj_season: '',
},
/**
* 生命周期函数--监听页面加载
*/
onLoad: function(options) {
// 接收上一个页面传入的年、季、月
var month = options.month;
var year = options.year;
var season = options.season;
// 将其挂载到data便于页面使用
this.setData({
caption: year + month
});
this.setData({
ecLine: {
onInit: this.initChart_cust('echarts_obj_catch')
}
});
// 初始化echarts ,同时挂载到data
this.setData({
ecLineSeason: {
onInit: this.initChart_cust('echarts_obj_season')
}
});
this.printPie(); // 打印饼图
},
/**
* 打印饼图
*
*/
printPie: function() {
let that = this;
// 初始化echarts ,同时挂载到data
wx.showLoading({
title: '数据加载中......',
})
// 此处假设我们使用wx.requiest请求后台获取到了所需数据,重置option
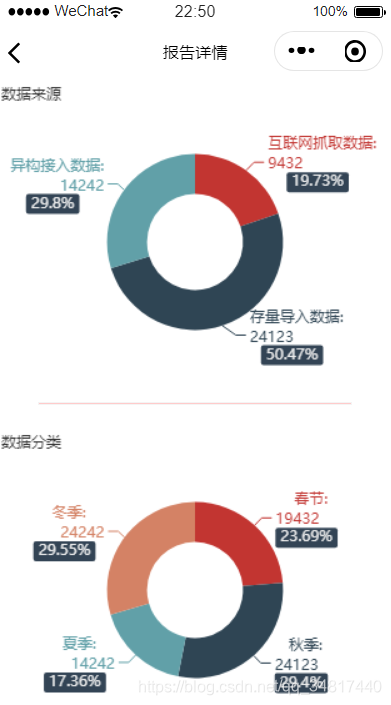
//打印第一个图形 [数据来源]
setTimeout(function() {
that.loadEchartsByBackstage(
that.data.initchartSource,
'数据来源',
'当月月报', [{
value: 9432,
name: '互联网抓取数据'
},
{
value: 24123,
name: '存量导入数据'
},
{
value: 14242,
name: '异构接入数据'
}
]);
//打印第二个图形【数据分类】
that.loadEchartsByBackstage(
that.data.initchartType,
'数据分类',
'当前季度', [{
value: 19432,
name: '春节'
},
{
value: 24123,
name: '秋季'
},
{
value: 14242,
name: '夏季'
},
{
value: 24242,
name: '冬季'
}
]);
wx.hideLoading();
}, 200);
},
/**
* 初始化echats
* @return {Object} echart
*
*/
initChart_cust: function(bindTarget) {
let that = this;
return function(canvas, width, height) {
const echarts_obj = echarts.init(canvas, null, {
width: width,
height: height
});
canvas.setChart(echarts_obj);
echarts_obj.setOption(optionConfig);
// 将echarts 挂载到data中;便于wx.reques请求完成重置option
bindTarget === 'echarts_obj_catch' ? that.data.echarts_obj_catch = echarts_obj : that.data.echarts_obj_season = echarts_obj;
}
},
/**
* 从服务器获取数据
*
*/
loadEchartsByBackstage: function(echarCasch, title, seriesName, dataArray) {
echarCasch.setOption({
title: {
text: title
},
series: [{
name: seriesName,
data: dataArray
}]
});
}
})
初步推断主要原因是
    this.setData({
      ecLine: {
        onInit: this.initChart_cust('echarts_obj_catch')
      }
    });

    // 初始化echarts ,同时挂载到data
    this.setData({
      ecLineSeason: {
        onInit: this.initChart_cust('echarts_obj_season')
      }
    });
这个两个初始化方法的问题。
三、 修改后
1、 report-detail.wxml 页面绑定
     <view class="echart_panel">
    <ec-canvas id="sorce-pie" canvas-id="source-pie" ec="{{ecLine}}" bind:init="echartInit_source"></ec-canvas>
  </view>
   <view class="hr"></view>
  <view class="echart_panel">
    <ec-canvas id="type-pie" canvas-id="type-pie" ec="{{ecLineSeason}}" bind:init="echartInit_type"></ec-canvas>
  </view>
2、report-detail.js 数据初始化
import * as echarts from '../../../ec-canvas/echarts';
var getOptionByExternalJs = require('../../../echart-template/echart-option-config.js');
var optionConfig = new getOptionByExternalJs();
Page({

  /**
   * 页面的初始数据
   */
  data: {
    contentTxt: '平台通过存量数据导入,异构数据导入、异构系统/平台计入及互联网抓取方式,共汇集空间信息数据',
    spaceNum: 23423,
    stockNum: 234422,
    specialNum: 347458,
    internetNum: 89079,
    ecLine: {},
    ecLineSeason: {}
  },

  /**
   * 生命周期函数--监听页面加载
   */
  onLoad: function(options) {
    // 接收上一个页面传入的年、季、月
    var month = options.month;
    var year = options.year;
    var season = options.season;
    // 将其挂载到data便于页面使用
    this.setData({
      caption: year + month
    });
    this.printPie(); // 打印饼图
  },
  /**
   * 打印饼图
   *
   */
  printPie: function() {
    let that = this;
    // 初始化echarts ,同时挂载到data

    wx.showLoading({
      title: '数据加载中......',
    })
    // 此处假设我们使用wx.requiest请求后台获取到了所需数据,重置option
    //打印第一个图形 [数据来源]
    setTimeout(function() {
      that.loadEchartsByBackstage(
        that.data.initchartSource,
        '数据来源',
        '当月月报', [{
            value: 9432,
            name: '互联网抓取数据'
          },
          {
            value: 24123,
            name: '存量导入数据'
          },
          {
            value: 14242,
            name: '异构接入数据'
          }
        ]);
      //打印第二个图形【数据分类】
      that.loadEchartsByBackstage(
        that.data.initchartType,
        '数据分类',
        '当前季度', [{
            value: 19432,
            name: '春节'
          },
          {
            value: 24123,
            name: '秋季'
          },
          {
            value: 14242,
            name: '夏季'
          },
          {
            value: 24242,
            name: '冬季'
          }
        ]);
      wx.hideLoading();
    }, 200);
  },
  /**
   * 初始化echats
   * @return {Object} echart
   *
   */
  initChart: function(canvas, width, height) {
    const chart = echarts.init(canvas, null, {
      width: width,
      height: height
    });
    canvas.setChart(chart);
    chart.setOption(optionConfig);
    return chart;
  },
  // 来源
  echartInit_source(e) {
    this.data.initchartSource = this.initChart(e.detail.canvas, e.detail.width, e.detail.height);
  },
  //分类
  echartInit_type(e) {
    this.data.initchartType = this.initChart(e.detail.canvas, e.detail.width, e.detail.height);
  },
  /**
   * 从服务器获取数据
   *
   */
  loadEchartsByBackstage: function(echarCasch, title, seriesName, dataArray) {
    echarCasch.setOption({
      title: {
        text: title
      },
      series: [{
        name: seriesName,
        data: dataArray
      }]
    });
  }
})
哈哈!总算从这个坑中扒出来了
最后附上该案例所需其他文件云盘地址 https://pan.baidu.com/s/1rQotOfPVZcaPcY4HpjyHeg 提取码 yrol