https://www.activestate.com/blog/top-10-python-packages-for-finance-and-financial-modeling/
Top 10 Python Packages For Finance And Financial Modeling

The popularity of the Python programming language is due, at least in part, to the versatility that it offers. In addition to the vast number of use cases in web and app development, Python provides the tools for building and implementing any type of scientific or mathematical model, regardless of the origin or type of data. This versatility is enabled by the extensive standard library that offers a range of facilities intended to enhance the functionality and portability of the language. For more specific applications, the Python Package Index (PyPI) provides additional packages that extend the capabilities of Python to fit the needs of each domain.
For these reasons, Python has proven to be a formidable tool in developing novel financial technologies. From crunching the raw numbers to creating aesthetically pleasing, yet intuitive Graphical User Interfaces (GUIs), a myriad of packages exist to help users build their own financial models. In this article, I’ll highlight my top 10 packages for finance and financial modeling with a few basic examples. All of these packages (except quantlib) are available on the ActiveState Platform for inclusion in your runtime environment.
The Most Useful Python Packages For Finance
The field of financial technologies is vast, encompassing everything from insurance, lending and trading, to e-banking and other payment services. This article focuses on applications specific to quantitative finance, which require programming tasks such as data importation and transformation, time series and risk analysis, trading and backtesting, excel integration, and data visualization. I sample a few of the best packages for accomplishing each task.
#1 NumPy
At base, all financial models rely on crunching numbers. The first few packages I have in the list provide the framework to do so. The first is NumPy. NumPy is the most essential package for scientific and mathematical computing in Python. Not only does it introduce n-dimensional arrays and matrices into Python, but also contains some basic mathematical functions to manipulate these data structures. Most of the higher-level Python packages for finance mentioned later in this list depend on NumPy.
For example, to create two 2×2 complex matrices and print the sum:
import numpy as np

a = np.array([[1+2j, 2+1j], [3, 4]])
b = np.array([[5, 6+6j], [7, 8+4j]])
print(a+b)
Output:
[[6.+2.j   8.+7.j]
 [10.+0.j 12.+4.j]]
And to take the complex conjugate of one of them:
np.conj(a)
More information about how NumPy is used can be found here.
#2 SciPy
The NumPy package provides basic mathematical structures for manipulating and storing data. But in order to build sophisticated models based on this data, a repository of more advanced statistical tools and operations is needed. Enter SciPy. This package provides functions and algorithms critical to the advanced scientific computations needed to build any statistical model. These include algorithms for interpolation, optimization, clustering, transformation, and integration of data. These operations are essential when performing any type of data analysis, or building any type of predictive model.
To demonstrate interpolation, I first use NumPy to create some data points with an arbitrary function, then compare different interpolation methods:
from scipy.interpolate import interp1d
import pylab

x = np.linspace(0, 5, 10)
y = np.exp(x) / np.cos(np.pi * x)

f_nearest = interp1d(x, y, kind='nearest')
f_linear  = interp1d(x, y)
f_cubic   = interp1d(x, y, kind='cubic')

x2 = np.linspace(0, 5, 100)

pylab.plot(x, y, 'o', label='data points')
pylab.plot(x2, f_nearest(x2), label='nearest')
pylab.plot(x2, f_linear(x2), label='linear')
pylab.plot(x2, f_cubic(x2), label='cubic')
pylab.legend()
pylab.show()

#3 Pandas
NumPy and SciPy lay the mathematical groundwork. The panda’s package, on the other hand, establishes an intuitive and easy-to-use data structure, a DataFrame, specifically designed for analysis and model building. It is based on the arrays that NumPy introduces, and is optimized for tabular, multidimensional, and heterogeneous data. The most common manipulations, such as groupby, joining, merging, or filling, replacing and imputing null values, can be executed in a single line. In addition, the package provides functions for importing data from a variety of standard formats, and others for rapid plotting, retrieving basic statistics, or outputting data.
To create a DataFrame:
import pandas as pd

df_1 = pd.DataFrame({'col1': [1,2], 'col2': [3,4]})
And to concatenate two dataframes together:
df_2 = pd.DataFrame({'col3': [5,6], 'col4': [7,8]})
df = pd.concat([df_1,df_2], axis = 1)
Output:
    col1   col2    col3    col4
0      1      3       5       7
1      2      4       6       8
To perform a simple filtering operation, extracting the row that meets the logical condition:
df[df.col3 == 5]
Further examples can be found in the documentation here.
#4 statsmodels
SciPy provides a library of statistical tools that allow users to construct a model, and pandas makes it easy to implement. The statsmodels package builds on these packages by implementing more advanced testing of different statistical models. An extensive list of result statistics and diagnostics for each estimator is available for any given model, with the goal of providing the user with a full picture of model performance. The results are tested against existing statistical packages to ensure that they are correct.
As an example, I import a built-in dataset:
import numpy as np
import statsmodels.api as sm

rand_data = sm.datasets.randhie.load(as_pandas=False)
rand_exog = rand_data.exog.view(float).reshape(len(rand_data.exog), -1)
rand_exog = sm.add_constant(rand_exog, prepend=False)
And to fit the dataset with a Poisson model:
poisson_mod = sm.Poisson(rand_data.endog, rand_exog)
poisson_res = poisson_mod.fit(method="newton")
print(poisson_res.summary())
The output should look something like this:

More information can be found here.
#5 Quandl
Up to now, the packages I have listed are impartial to the type of data being considered. Of course, when considering financial models, we need financial data. This is where Quandl comes to the rescue. The Quandl Python module gives users access to the vast collection of economic, financial, and market data collected from central banks, governments, multinational organizations and many other sources. Most of the raw datasets are free to access upon sign up (you need an API key), with more advanced and in-depth datasets available at a cost.
The package documentation can be found here.
#6 Zipline
Zipline is a package that ties the statistics, the data structures, and the data sources all together. It is a formidable algorithmic trading library for Python, evident by the fact that it powers Quantopian, a free platform for building and executing trading strategies. Data from Quandl is easily imported, and custom algorithms easily designed, tested, and implemented. This includes backtesting of algorithms and live trading. A basic algorithm looks like this:
from zipline.api import order, record, symbol

def initialize(context):
    pass

def handle_data(context, data):
    order(symbol('AAPL'), 10)
    record(AAPL=data.current(symbol('AAPL'), 'price'))
We import the order, record, and symbol functions from zipline, to build an algorithm that records the stock price of Apple. For more examples of algorithms, see the documentation.
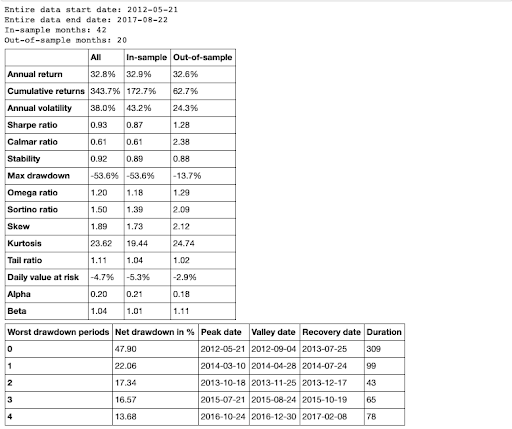
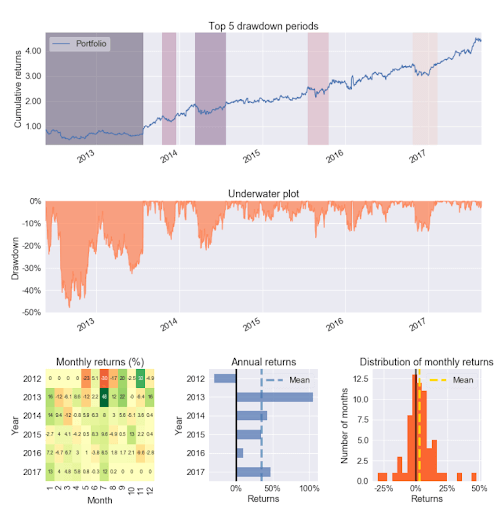
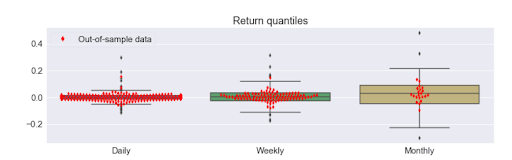
#7 Pyfolio
After designing and testing an algorithm in zipline, the pyfolio package provides an easy way to generate a tearsheet containing performance statistics. These statistics include annual/monthly returns, return quantiles, rolling beta/Sharpe ratios, portfolio turnover, and a few more. To generate a sample tearsheet on a single stock:
import pyfolio as pf

stock_rets = pf.utils.get_symbol_rets('FB')
pf.create_returns_tear_sheet(stock_rets, live_start_date='2015-12-1')
The output will be a series of tables and plots containing the performance metrics.


The documentation has a few more examples that go into further detail.
#8 TA-Lib
The next two packages are alternatives to using zipline and pyfolio. The first is the Technical Analysis Library, or TA-Lib for short. The project is written in C++, but a wrapper for Python exists. Like zipline, TA-Lib provides common financial tools such as overlap studies, momentum indicators, volume indicators, volatility indicators, price transformations, cycle indicators, pattern recognition, and pure statistical functions.
A full list of the capabilities can be found here.
#9 QuantLib
The second alternative to zipline and pyfolio is QuantLib. Similar to TA-Lib, QuantLib is written in C++ and then exported to Python. The QuantLib project aims to create a free, open-source library for modeling, trading, and risk management. The package contains tools to design and implement advanced algorithms that include features such as market conventions, yield curve models, solvers, PDEs, Monte Carlo, and others.
The project has been around for almost 20 years, and there is extensive documentation.
#10 Matplotlib
The aforementioned python packages for finance establish financial data sources, optimal data structures for financial data, as well as statistical models and evaluation mechanisms. But none provide one of the most important Python tools for financial modeling: data visualization (all the visualizations in this article are powered by matplotlib).
Not only is visualization important for understanding trends within financial data, but also for conveying insights to non-technical personnel. There are more than a few data visualization packages within Python, each with positives and negatives (see my article here), but the easiest to implement for financial modeling is matplotlib. This is mainly due to the fact that many of the packages in this list already rely on matplotlib. Additionally, the documentation is plentiful, and the syntax simple and straightforward.
Conclusions
In this article, I’ve picked out the top 10 most useful python packages for finance. It’s interesting to note that since the last time ActiveState did a roundup of Python packages for finance (2010), many of the top packages have changed but numpy, scipy and matplotlib remain key.
To get started with the packages on this list, create a free ActiveState Platform account and then download our “Top 10 Finance Packages” build. The build contains a version of Python 3.8 and most of the packages listed in this post so you can test them out for yourself.
The simplest way to install the environment is to first install the ActiveState Platform’s command line interface (CLI), the State Tool.
- If you’re on Linux , you can use curl to install the State Tool:
sh <(curl -q https://platform.activestate.com/dl/cli/install.sh)
Once the State Tool is installed, just run the following command to download the build and automatically install it into a virtual environment:state activate Pizza-Team/Top-10-Finance-Packages/
All of these packages (except quantlib) are available on the ActiveState Platform for inclusion in your runtime environment. One of the key advantages of the ActiveState Platform is it’s “build environment on demand” capabilities, allowing you to build packages that contain C code from source without the need to set up your own environment or source your own compiler. If code provenance is of value to your organization, the ActiveState platform can help lower the time and resources you spend sourcing and building your runtimes.
Related Blogs:
Plotting Data in Python: matplotlib vs plotly
Top 10 Python Packages for Machine Learning