此次记录主要是为了下次使用时能回忆起来才做得笔记,若有需改进的地方,请不吝珠玉。
widget.cpp
 1 #include "widget.h"
 2 #include "ui_widget.h"
 3
 4 Widget::Widget(QWidget *parent) :
 5     QWidget(parent),Chartdisplay(new ChartDisplay),
 6     ui(new Ui::Widget)
 7 {
 8     ui->setupUi(this);
 9     Chartdisplay->Ploar1Init(ui->customplot);//CustomPlot初始化
10     Chartdisplay->Ploar1PrapareData();//数据填充
11 }
12
13 Widget::~Widget()
14 {
15     delete ui;
16 }
widget.h
 1 #ifndef WIDGET_H
 2 #define WIDGET_H
 3
 4 #include <QWidget>
 5 #include <QGroupBox>
 6 #include <QGridLayout>
 7 #include "chartdisplay.h"
 8
 9 namespace Ui {
10 class Widget;
11 }
12
13 class Widget : public QWidget
14 {
15     Q_OBJECT
16
17 public:
18     explicit Widget(QWidget *parent = 0);
19     ~Widget();
20
21 private:
22     Ui::Widget *ui;
23     ChartDisplay *Chartdisplay;
24
25 };
26
27 #endif // WIDGET_H
chartdisplay.cpp
 1 #include "chartdisplay.h"
 2
 3 ChartDisplay::ChartDisplay(QWidget *parent) : QWidget(parent){}
 4
 5 //CustomPlot初始化 坐标显示标签初始化
 6 void ChartDisplay::Ploar1Init(QCustomPlot *customplot)
 7 {
 8     //初始化坐标系范围和意义
 9     CustomPlot = customplot;
10     CustomPlot->addGraph();
11     CustomPlot->setSelectionTolerance(1);
12     CustomPlot->graph(0)->setPen(QPen(Qt::darkGray,3,Qt::SolidLine));
13     CustomPlot->graph(0)->setScatterStyle(QCPScatterStyle(QCPScatterStyle::ssNone,1));//曲线样式 样式大小
14     CustomPlot->xAxis->setLabel("X");
15     CustomPlot->yAxis->setLabel("Y");
16     CustomPlot->xAxis->setRange(0,100);
17     CustomPlot->yAxis->setRange(-100,100);
18     CustomPlot->rescaleAxes(true);//开启自适应
19     CustomPlot->setInteractions( QCP::iSelectPlottables | QCP::iRangeDrag |QCP::iRangeZoom );//先设置customplot的plottable绘图层可选  鼠标拖拽 滚轮缩放
20
21     TextTip = new QCPItemText(CustomPlot);
22     TextTip->setPositionAlignment(Qt::AlignTop|Qt::AlignHCenter);
23     TextTip->position->setType(QCPItemPosition::ptAbsolute);
24     QFont font;
25     font.setPixelSize(15);
26     TextTip->setFont(font); // make font a bit larger
27     TextTip->setPen(QPen(Qt::black)); // show black border around text
28     TextTip->setBrush(Qt::white);
29     TextTip->setVisible(false);
30     connect(CustomPlot, SIGNAL(plottableClick(QCPAbstractPlottable*, int, QMouseEvent*)), this, SLOT(OnPlotClick(QCPAbstractPlottable*, int, QMouseEvent*)));//关联选点信号
31 }
32
33 //CustomPlot数据填充
34 void ChartDisplay::Ploar1PrapareData()
35 {
36     QVector<double> Xvalue(100);
37     QVector<double> Yvalue(100);
38     for (int i = 0; i < 100; i++) {
39       Xvalue[i]=i;
40       Yvalue[i]=100*qSin(i * 10.0f / 100);
41     }
42     CustomPlot->graph(0)->setData(Xvalue,Yvalue);
43     CustomPlot->replot();//重绘图形
44 }
45
46 //选点处理函数
47 void ChartDisplay::OnPlotClick(QCPAbstractPlottable *plottable, int dataIndex, QMouseEvent *event)
48 {
49   //先获取点击的绘图层名称,然后通过名称找到图层ID,再找到对应的数据点  这里因为知道ID 所以直接使用 没有通过名称找
50   const QCPGraphData *ghd = CustomPlot->graph(0)->data()->at(dataIndex);
51   QString text = "(" + QString::number(ghd->key,10,0) + "," + QString::number(ghd->value,10,0) + ")";
52   TextTip->setText(text);//文本内容填充
53   TextTip->position->setCoords(event->pos().x()+30, event->pos().y()-15);//文本框所在位置
54   TextTip->setVisible(true);
55   CustomPlot->replot();
56 }
chartdisplay.h
 1 #ifndef CHARTDISPLAY_H
 2 #define CHARTDISPLAY_H
 3 #include <QWidget>
 4 #include "qcustomplot.h"
 5
 6
 7 class ChartDisplay : public QWidget
 8 {
 9     Q_OBJECT
10 public:
11     explicit ChartDisplay(QWidget *parent = nullptr);
12     QCustomPlot *CustomPlot;
13     QCPItemText *TextTip;
14     void Ploar1Init(QCustomPlot *customplot);
15     void Ploar1PrapareData();
16 private slots:
17     void OnPlotClick(QCPAbstractPlottable *plottable, int dataIndex, QMouseEvent *event);
18 };
19
20 #endif // CHARTDISPLAY_H
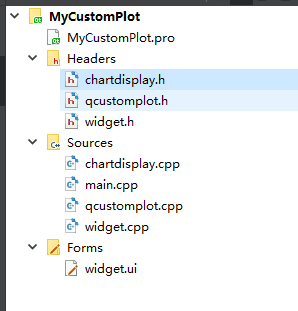
所有文件结构如图1所示
第一点:qcustomplot.h 和 qcustomplot.cpp可以直接去这里 http://www.qcustomplot.com/找找看;
第二点:下载完成后把.cpp和.h放在工程目录下,并将cpp和h加入工程;
第三点:切记要在.pro中:QT += printsupport;
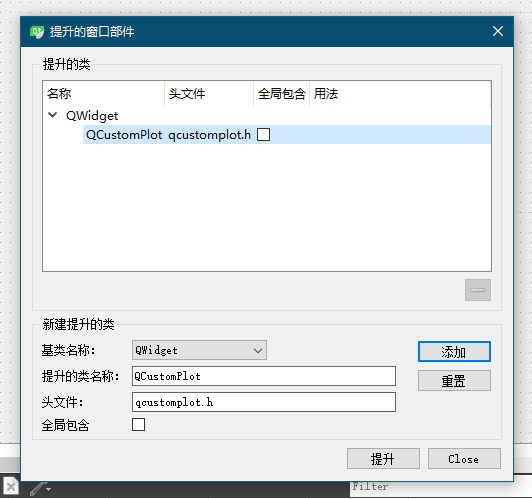
第四点:在ui中添加一个Widget,右键提升为,如图2 输入:QCustomPlot后,下面会自动生成头文件,记得深蓝色部分一定要勾选哦,之后点提升即可;
第五点:最后改变对象名称为customplot就可以和上面的代码吻合了;
图1

图2

效果图如图3所示 由于只是测试是否可以显示坐标,所以没有改进代码, ![]() 显示后挥之不去,哈哈^_^有点小尴尬。不过实际做项目的时候会在线程加上下面这句代码,实际效果还没有测试。(实测中发现如果不太耐心的人点击的时候应该会疯掉的罒ω罒)
显示后挥之不去,哈哈^_^有点小尴尬。不过实际做项目的时候会在线程加上下面这句代码,实际效果还没有测试。(实测中发现如果不太耐心的人点击的时候应该会疯掉的罒ω罒)
1 TextTip->setVisible(false);
图3

这只是一个基础代码,功能不是太多,需要后续拓展。我就不多解释代码了,注释应该已经很清楚了。
常怀一颗心————空杯心