1、什么是T test?
t-test:比较数据的均值,告诉你这两者之间是否相同,并给出这种不同的显著性(即是否是因为偶然导致的不同)
The t test (also called Student’s T Test) compares two averages (means) and tells you if they
 are different from each other. The t test also tells you how significant the differences are;In
other words it lets you know if those differences could have happened by chance.
例子:制药公司可能想测试一种新的抗癌药物,看看它是否能提高预期寿命。在实验中,总有一个对照组(给一组人服用安慰剂,或“糖丸”)。对照组的平均预期寿命为+5岁,而服用新药的组的平均预期寿命为+6岁。看来这种药可能有效。但这可能是一个巧合。为了验证这一点,研究人员将使用Student’s t-test来发现结果是否可以在整个人群中重复
Student’s T-tests can be used in real life to compare means. For example, a drug company may
want to test a new cancer drug to find out if it improves life expectancy. In an experiment,
there’s always a control group (a group who are given a placebo, or “sugar pill”). The control
 group may show an average life expectancy of +5 years, while the group taking the new drug
might have a life expectancy of +6 years. It would seem that the drug might work. But it could
be due to a fluke. To test this, researchers would use a Student’s t-test to find out if the
results are repeatable for an entire population.
2、The T Score.
T Score:是两组之间的差异与组内差异的比值。t值越大,组间差异越大。t值越小,组间的相似性越大。t得分为3表示两个组之间的差异是它们内部差异的三倍。当您运行t测试时,t值越大,结果越有可能是可重复的
The t score is a ratio between the difference between two groups and the difference within the
 groups. The larger the t score, the more difference there is between groups. The smaller the t
 score, the more similarity there is between groups. A t score of 3 means that the groups are
three times as different from each other as they are within each other. When you run a t test,
the bigger the t-value, the more likely it is that the results are repeatable
- A large t-score tells you that the groups are different.
- A small t-score tells you that the groups are similar
3、T-Values and P-values
P-values:“足够大”有多大?每个t值都有一个p值。p值是样本数据的结果偶然发生的概率。p值从0%到100%。它们通常写成小数。例如,5%的p值是0.05。低p值是好的;它们表明您的数据不是偶然产生的。例如,p值为0.01意味着实验结果碰巧发生的概率只有1%。在大多数情况下,p值为0.05(5%)表示数据有效
How big is “big enough”? Every t-value has a p-value to go with it. A p-value is the probability
 that the results from your sample data occurred by chance. P-values are from 0% to 100%.
 They are usually written as a decimal. For example, a p value of 5% is 0.05. Low p-values are
 good; They indicate your data did not occur by chance. For example, a p-value of .01 means
 there is only a 1% probability that the results from an experiment happened by chance. In
 most cases, a p-value of 0.05 (5%) is accepted to mean the data is valid.
4、main types of t-test
An Independent Samples t-test((also called the unpaired samples t test)) compares the means for two groups.
A Paired sample t-test(also called a correlated pairs t-test, a paired samples t test or dependent
samples t test) compares means from the same group at different times (say, one year apart).
A One sample t-test tests the mean of a single group against a known mean.
4.1、 Independent Samples t-test
独立样本t检验(又称未配对样本t检验)是t检验最常见的形式。它帮助您比较两组数据的方法。例如,你可以做一个t测试,看看男性和女性的平均测试成绩是否不同;测试回答了这个问题:“这些差异可能是随机产生的吗?”
前提是需要三个假设:独立假设、正态分布假设、方差同质性假设
  Assumption of Independence: you need two independent, categorical groups that represent
 your independent variable. In the above example of test scores “males” or “females” would be
 your independent variable.
  Assumption of normality: the dependent variable should be approximately normally
 distributed. The dependent variable should also be measured on a continuous scale. In the
above example on average test scores, the “test score” would be the dependent variable.
 Assumption of Homogeneity of Variance: The variances of the dependent variable should be equal.
手动计算:Calculating an Independent Samples T Test By hand(https://www.statisticshowto.datasciencecentral.com/independent-samples-t-test/)
Sample question: Calculate an independent samples t test for the following data sets:
Data set A: 1,2,2,3,3,4,4,5,5,6
Data set B: 1,2,4,5,5,5,6,6,7,9
Step 1: Sum the two groups(求各自样品的总和):
A: 1 + 2 + 2 + 3 + 3 + 4 + 4 + 5 + 5 + 6 = 35
B: 1 + 2 + 4 + 5 + 5 + 5 + 6 + 6 + 7 + 9 = 50
Step 2: Square the sums from Step 1(求各自样品总和的平方):
35 * 35= 1225
49 * 49 = 2401
Step 3: Calculate the means for the two groups:
A: (1 + 2 + 2 + 3 + 3 + 4 + 4 + 5 + 5 + 6)/10 = 35/10 = 3.5
B: (1 + 2 + 4 + 5 + 5 + 5 + 6 + 6 + 7 + 9) = 50/10 = 5
Step 4: Square the individual scores and then add them up:
A: 11 + 22 + 22 + 33 + 33 + 44 + 44 + 55 + 55 + 66 = 145
B: 12 + 22 + 44 + 55 + 55 + 55 + 66 + 66 + 77 + 99 = 298
Step 5: Find the Degrees of freedom
(nA-1 + nB-1) =(10-1)+(10-1)= 18
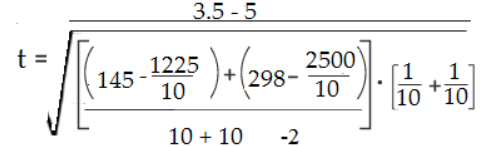
Step 6: Insert your numbers into the following formula and solve:
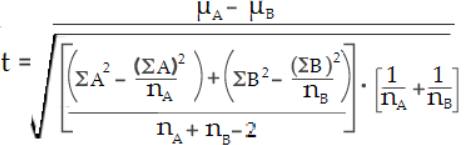
带入求值结果为-1.69
(ΣA)2: Sum of data set A, squared (Step 2).
(ΣB)2: Sum of data set B, squared (Step 2).
μA: Mean of data set A (Step 3)
μB: Mean of data set B (Step 3)
ΣA2: Sum of the squares of data set A (Step 4)
ΣB2: Sum of the squares of data set B (Step 4)
nA: Number of items in data set A
nB: Number of items in data set B
Step 7: Look up your degrees of freedom (Step 5) in the t-table(https://www.statisticshowto.datasciencecentral.com/tables/t-distribution-table/).
If you don’t know what your alpha level is, use 5% (0.05).18 degrees of freedom at an alpha level of 0.05 = 2.10.
Step 8: Compare your calculated value (Step 6) to your table value (Step 7).
The calculated value of -1.79 is less than the cutoff of 2.10 from the table. Therefore p >0 .05.
As the p-value is greater than the alpha level, we cannot conclude that there is a difference
between means.
4.2、 A paired t test
配对t测试(也称为相关配对t测试、配对样本t测试或依赖样本t测试)是在依赖样本上运行t测试的地方。依赖的样本本质上是相连的—它们是同一个人或事物的测试。例如训练前后对同一个人进行两次测试;同一个人使用不同的仪器进行两次血压测量。
手动计算paired t test:https://www.statisticshowto.datasciencecentral.com/probability-and-statistics/t-test/
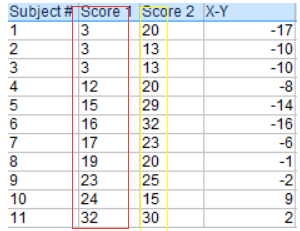
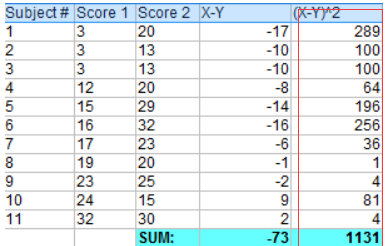
小明前后两次考试:
score1: 3、 3、 3、12、15、16、17、19、23、24、32
score2: 20、13、13、20、29、32、23、20、25、15、30
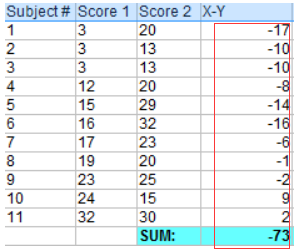
Step 1: Subtract each Y score from each X score(每个Y分数减去每个X分数).
步骤2:将步骤1中的所有值相加
步骤3:将与步骤1的差异平方

步骤4:将所有与步骤3不同的平方相加
步骤5:用以下公式计算t-score:
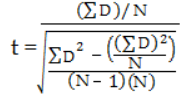
ΣD: Sum of the differences (Sum of X-Y from Step 2)
ΣD2: Sum of the squared differences (from Step 4)
(ΣD)2: Sum of the differences (from Step 2), squared
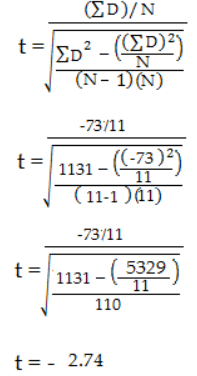
Step 6: Subtract 1 from the sample size to get the degrees of freedom(计算自由度).
We have 11 items, so 11-1 = 10.
Step 7: Find the p-value in the t-table, using the degrees of freedom in Step 6.
If you don’t have a specified alpha level, use 0.05 (5%). For this sample problem, with df=10, the t-value is 2.228.
步骤8:比较步骤7(2.228)到计算t值(-2.74)的t表值(table表)。
在alpha水平为0.05时,计算的t值大于表值。p值小于alpha水平:p <0.05。我们可以拒绝均值之间没有差异的零假设。
5、参考网址
https://www.statisticshowto.datasciencecentral.com/probability-and-statistics/t-test/
https://www.statisticshowto.datasciencecentral.com/tables/t-distribution-table/