一句话:我们经常会面对非模式物种的GO或者KEGG富集与注释。
1、载入我们所需要的包
if("clusterProfiler" %in% rownames(installed.packages()) == FALSE) {source("http://bioconductor.org/biocLite.R");biocLite("clusterProfiler")}
biocLite("colorspace")
suppressMessages(library(clusterProfiler))
ls("package:clusterProfiler")

library(AnnotationHub)
library(biomaRt)
library(enrichGO)
2、收索目标物种
hub <- AnnotationHub()
unique(hub$dataprovider)   #查看数据注释来源
query(hub, "Apis cerana")

3、抓取目标OrgDb
Apis_cerana.OrgDb <- hub[["AH62635"]]
columns(Apis_cerana.OrgDb)
Apis_cerana.OrgDb
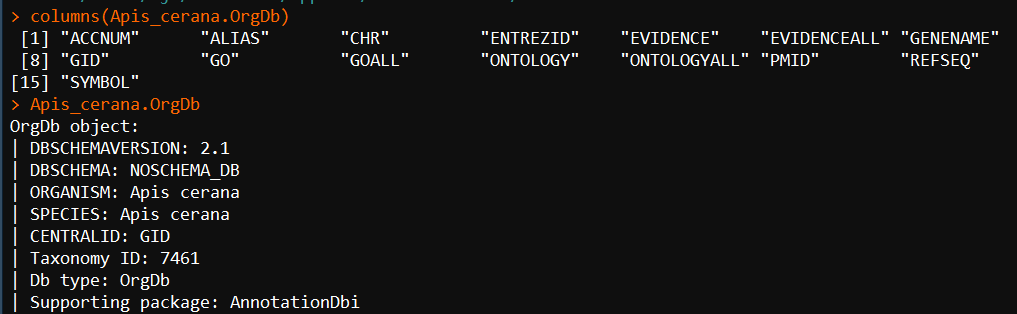
4、了解这个Apis_cerana.OrgDb对象
4.1、以symbol形式展示
head(keys(Apis_cerana.OrgDb,keytype = "SYMBOL"),30)

4.2、可以查看gene类型
keytypes(Apis_cerana.OrgDb)

4.3、默认基因是以ENTREZID,例如查看前90个基因。
keys(Apis_cerana.OrgDb)[1:50]

4.4、格式转换。例如将上面前50个基因转换为SYMBOL格式对照
bitr(keys(Apis_cerana.OrgDb)[1:50], 'ENTREZID', "SYMBOL", Apis_cerana.OrgDb)

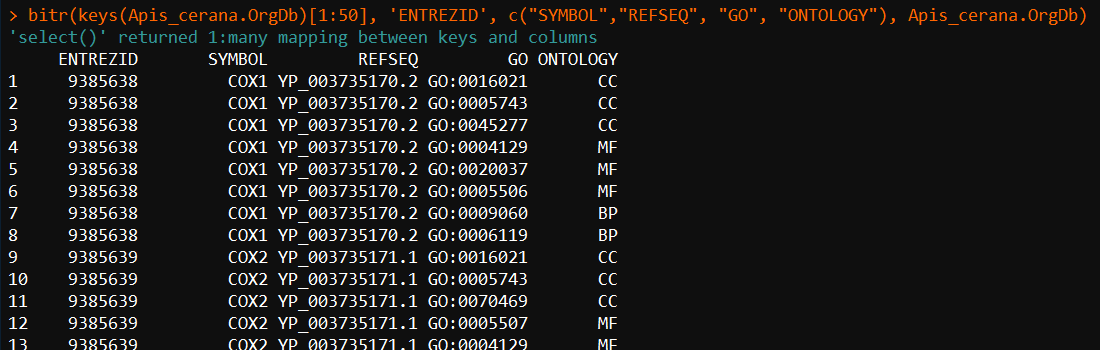
4.5、多个格式转化,例如将上面的50个基因转换为多个形式
bitr(keys(Apis_cerana.OrgDb), 'ENTREZID', c("SYMBOL","REFSEQ", "GO", "ONTOLOGY"), Apis_cerana.OrgDb)
5、测试
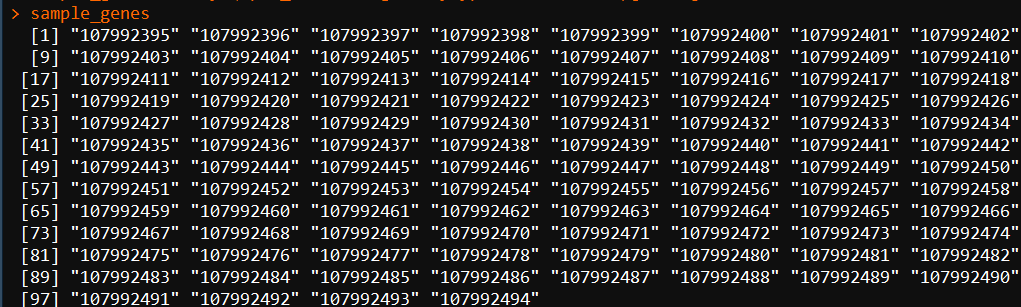
5.1、取前100个基因集做测试
sample_genes <- keys(Apis_cerana.OrgDb,keytype = "ENTREZID")[1:100]
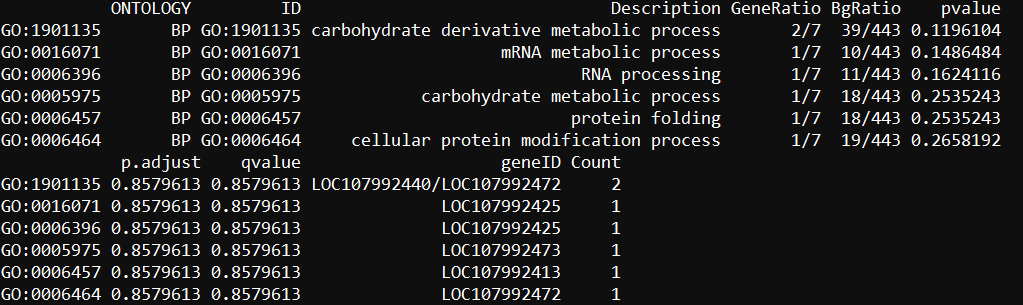
5.2、做GO富集分析
enrich.go = enrichGO( gene         = sample_genes,
                      OrgDb        = Apis_cerana.OrgDb,
                      keyType      = 'SYMBOL',
                      ont= "ALL",
                      pAdjustMethod = 'BH',
                      pvalueCutoff = 0.05,
                      qvalueCutoff = 0.1,
                      readable     = T)
head(enrich.go)dim(hainan_enrich.go)
dim(hainan_enrich.go[hainan_enrich.go$ONTOLOGY=='BP',])
dim(hainan_enrich.go[hainan_enrich.go$ONTOLOGY=='CC',])
dim(hainan_enrich.go[hainan_enrich.go$ONTOLOGY=='MF',])
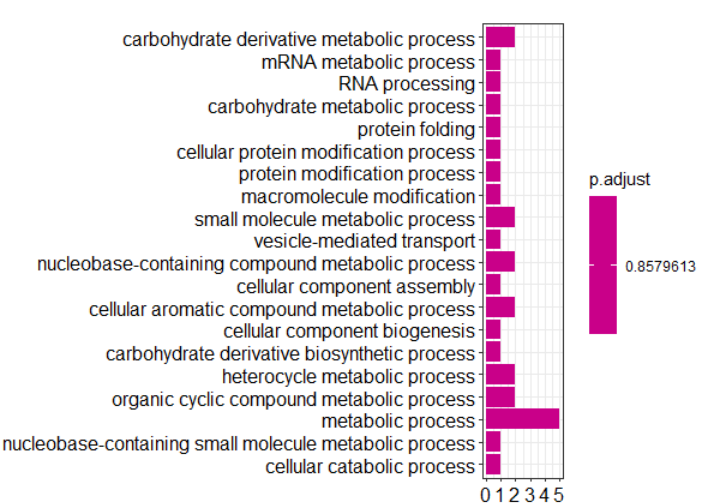
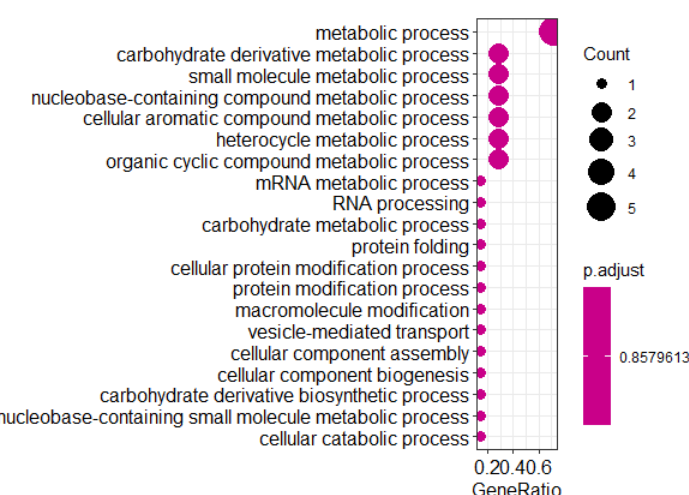
画图
barplot(hainan_enrich.go,showCategory=20,drop=T)
dotplot(hainan_enrich.go,showCategory=50)
write.table(as.data.frame(hainan_enrich.go), file="hainan_enrich_go.xls")
5.3、画GO分类图
5.3.1、重新取样,然后做GO富集分析
rm(list=ls()) #重头开始
sample_genes <- keys(Apis_cerana.OrgDb,keytype = "ENTREZID")[1:100]   #采样100个基因
ego_ALL  =  enrichGO(         gene         =sample_genes,
                             OrgDb        = Apis_cerana.OrgDb,
                             keyType      = 'ENTREZID',
                             ont= "ALL",
                             pAdjustMethod = 'BH',
                             pvalueCutoff =1,
                             qvalueCutoff =1,
                             readable     = T)
5.3.2、对富集结果进行分类
ego_result_BP <- ego_ALL[ego_ALL$ONTOLOGY=='BP',]
dim(ego_result_BP)

ego_result_CC <- ego_ALL[ego_ALL$ONTOLOGY=='CC',]
dim(ego_result_CC)

ego_result_MF <- ego_ALL[ego_ALL$ONTOLOGY=='MF',]
dim(ego_result_MF)
构建数据框
display_number = c(48, 26, 39)
go_enrich_df <- data.frame(ID          = c(ego_result_BP$ID, ego_result_CC$ID, ego_result_MF$ID),
                           Description = c(ego_result_BP$Description, ego_result_CC$Description, ego_result_MF$Description),
                           GeneNumber  = c(ego_result_BP$Count, ego_result_CC$Count, ego_result_MF$Count),
                           type        = factor(c(rep("biological process", display_number[1]), rep("cellular component", display_number[2]), rep("molecular function", display_number[3])), levels=c("molecular function", "cellular component", "biological process")))
缩短名称
## numbers as data on x axis
go_enrich_df$number <- factor(rev(1:nrow(go_enrich_df)))
#shorten the names of GO terms
shorten_names <- function(x, n_word=4, n_char=40){
               if (length(strsplit(x, " ")[[1]]) > n_word || (nchar(x) > 40))
               {
                 if (nchar(x) > 40) x <- substr(x, 1, 40)
                 x <- paste(paste(strsplit(x, " ")[[1]][1:min(length(strsplit(x," ")[[1]]), n_word)], collapse=" "), "...", sep="")
                 return(x) }
               else { return(x) }
}
设置画图轴
labels=(sapply(levels(go_enrich_df$Description)[as.numeric(go_enrich_df$Description)], shorten_names))
names(labels) = rev(1:nrow(go_enrich_df))
画图
library(ggplot2)
CPCOLS <- c("#8DA1CB", "#FD8D62", "#66C3A5")
library(ggplot2)
CPCOLS <- c("#8DA1CB", "#FD8D62", "#66C3A5")
p <- ggplot(data=go_enrich_df, aes(x=number, y=GeneNumber, fill=type)) +
            geom_bar(stat="identity", width=0.8) +
            coord_flip() +
            scale_fill_manual(values = CPCOLS) +
            theme_bw() +
            scale_x_discrete(labels=labels) +
            xlab("GO term") +
            theme(axis.text=element_text(face = "bold", color="gray50")) +
            labs(title = "ALL Enriched GO Terms")
p
pdf("go_enrichment_of_sample_targets.pdf")
dev.off()
svg("go_enrichment_of_sample_targets.svg")
p
dev.off()
参考文献
https://blog.csdn.net/sinat_30623997/article/details/79250940https://blog.csdn.net/sinat_30623997/article/details/79250940