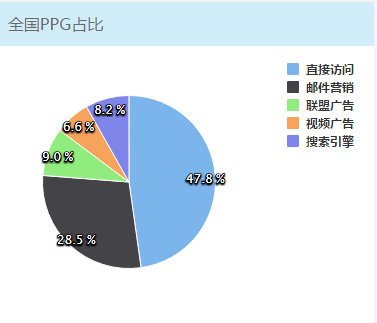
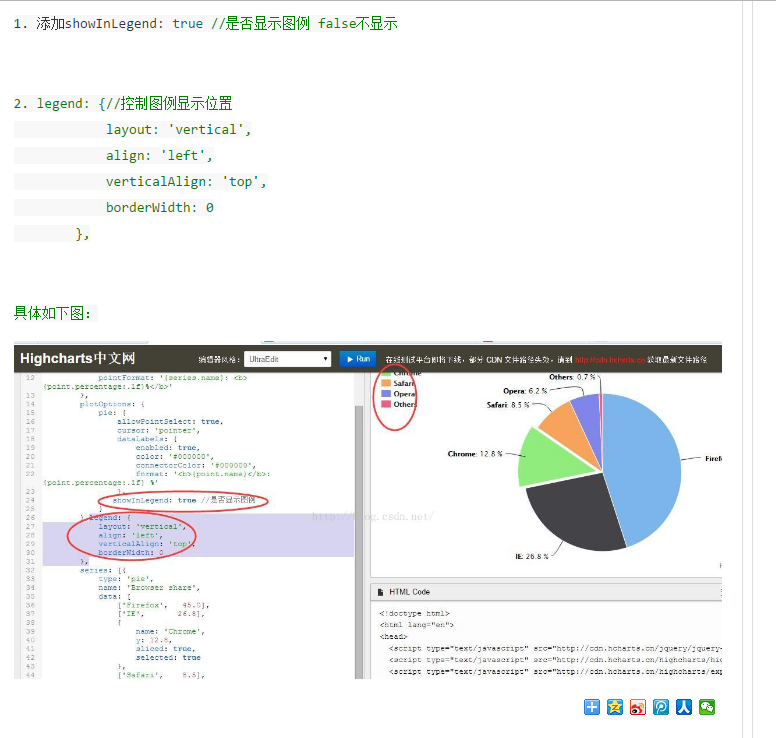
不需要引入css,有中文网站,此例是改进。注释
highcharts legend 饼图 图例位置 http://blog.csdn.net/kfyong/article/details/51082683
HTML
<script src="https://code.highcharts.com/highcharts.js"></script>
<div id="container" style="min- 377px;height:277px;"></div>
JAVASCRIPT
 1 <script>
 2     $(function () {
 3         $('#container').highcharts({
 4             //清除版本网址
 5             credits: {
 6                 enabled: false
 7             },
 8             chart: {
 9                 plotBackgroundColor: null,
10                 plotBorderWidth: null,
11                 plotShadow: false
12             },
13             //图的标题
14             title: {
15                 text: '',
16                 style: {
17                     height: '0px',
18                     display: 'none'
19                      }
20             },
21             //鼠标hover事件
22             tooltip: {
23                 headerFormat: '{series.name}<br>',
24                 pointFormat: '{point.name}: <b>{point.percentage:.1f}%</b>'
25             },
26             plotOptions: {
27                 pie: {
28                     allowPointSelect: true,
29                     cursor: 'pointer',
30                     //配置图上显示的文字
31                     dataLabels: {
32                         enabled: true,//是否显示块信息百分比
33                         distance: -10,//显示位置不配置会有线
34                         //format: '<b>{point.name}</b>: {point.percentage:.1f} %',
35                         format: '{point.percentage:.1f} %',
36                         style: {
37                             fontWeight: '400',
38                             color: 'white',
39                             textShadow: '0px 1px 2px black'
40                         }
41                         //style: {
42                         //    color: (Highcharts.theme && Highcharts.theme.contrastTextColor) || 'black'
43                         //}
44
45                     },
46                     showInLegend: true,//是否显示图例
47
48                 }
49             },
50             legend: {//控制图例显示位置
51                 layout: 'vertical',//垂直排列
52                 align: 'right',
53                 verticalAlign: 'top',
54                 //y: 50,//距上方的位置
55                 //symbolHeight: 12,//小图标的大小
56                 //symbolWidth: 12,
57                 symbolRadius: 1,//图标圆角
58                 itemDistance: 5,//图例间距
59             },
60             series: [{
61                 type: 'pie',
62                 name: '全国PPG占比',
63                 data: [
64                     ['直接访问', 45.0],
65                     ['邮件营销', 26.8],
66                     ['联盟广告', 8.5],
67                     ['视频广告', 6.2],
68                     ['搜索引擎', 7.7]
69                 ]
70             }]
71         });
72     });
73 </script>


