一、ps
我们用ps命令最多的就是查看系统进程,看它存在不存在,看它的进程id:
[ruan.wenwu@kddi-zol-fss-web1 conf]$ ps aux|grep nginx
root      4184  0.0  0.0  78372   192 ?        Ss   Dec07   0:00 nginx: master process /usr/local/nginx/sbin/nginx -c /usr/local/nginx/conf/nginx.conf
apache    4185  0.0  0.0 100288  1484 ?        S    Dec07   2:24 nginx: worker process
apache    4186  0.0  0.0 100284  6256 ?        S    Dec07   0:43 nginx: worker process
apache    4187  0.0  0.0 100380  1856 ?        S    Dec07   2:18 nginx: worker process
apache    4188  0.0  0.0 100600  2032 ?        S    Dec07   2:28 nginx: worker process
7180     12356  0.0  0.0 105380   896 pts/15   S+   09:22   0:00 grep nginx
就好比上面的4184进程,它是nginx的主进程。我们可以通过这个pid找到它的运行目录下的文件:
[ruan.wenwu@kddi-zol-fss-web1 proc]$ ls /proc/4185
ls: cannot read symbolic link /proc/4185/cwd: Permission denied
ls: cannot read symbolic link /proc/4185/root: Permission denied
ls: cannot read symbolic link /proc/4185/exe: Permission denied
attr       clear_refs       cpuset   fd      loginuid   mounts      numa_maps      pagemap      schedstat  stat     task
autogroup  cmdline          cwd      fdinfo  maps       mountstats  oom_adj        personality  sessionid  statm    wchan
auxv       comm             environ  io      mem        net         oom_score      root         smaps      status
cgroup     coredump_filter  exe      limits  mountinfo  ns          oom_score_adj  sched        stack      syscall
杀死进程:
kill pid就好了,比如我想杀死上面的nginx主进程,只要执行kill 4184就行了。
ps命令还可以让我们看到进程的状态。
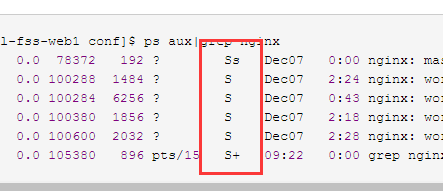
这一列就是状态列。
S代表sleep,代表他是睡眠状态,说不定过一会他还要执行。
s是主进程,4184进程就是s的了。
+是前台进程,我们刚才在shell里执行的ps aux|grep nginx就是这样的状态。

才外还有:
R:正在运行的进程
D:不能中断的进程
T:暂停的进程
Z:僵尸进程
<:高优先级进程
N:低优先级
I:多线程进程
二、查看网络状态
我们一般使用netstat命令查看我们的网络状态。比如我们的22号端口是否开启,80端口是否开启,有多少udp连接,有多少tcp的连接,连接的状态是什么等等。
查看80端口是否开启:
[ruan.wenwu@kddi-zol-fss-web1 proc]$ netstat -lnp|grep 80
(Not all processes could be identified, non-owned process info
 will not be shown, you would have to be root to see it all.)
tcp        0      0 :::80                       :::*                        LISTEN      -
查看系统的网络链接状况:
[ruan.wenwu@kddi-zol-fss-web1 proc]$ netstat -an
Active Internet connections (servers and established)
Proto Recv-Q Send-Q Local Address               Foreign Address             State
tcp        0      0 0.0.0.0:5666                0.0.0.0:*                   LISTEN
tcp        0      0 0.0.0.0:9000                0.0.0.0:*                   LISTEN
tcp        0      0 0.0.0.0:873                 0.0.0.0:*                   LISTEN
tcp        0      0 0.0.0.0:111                 0.0.0.0:*                   LISTEN
tcp        0      0 0.0.0.0:5200                0.0.0.0:*                   LISTEN
tcp        0      0 0.0.0.0:53                  0.0.0.0:*                   LISTEN
tcp        0      0 0.0.0.0:22                  0.0.0.0:*                   LISTEN
tcp        0      0 127.0.0.1:25                0.0.0.0:*                   LISTEN
tcp        0      0 0.0.0.0:443                 0.0.0.0:*                   LISTEN
tcp        0      0 10.19.37.158:39472          10.19.37.96:27017           ESTABLISHED
tcp        0      0 10.19.37.158:58064          10.19.37.43:27017           ESTABLISHED
tcp        0      0 10.19.37.158:14660          140.205.164.47:443          TIME_WAIT
tcp        1      0 10.19.37.158:15306          180.97.253.118:8080         CLOSE_WAIT
tcp        0      1 10.19.37.158:56470          106.11.186.60:443           SYN_SENT
tcp        0      0 10.19.37.158:14670          140.205.164.47:443          TIME_WAIT
tcp        0      0 10.19.37.158:14186          10.19.37.96:27017           ESTABLISHED
tcp        0      0 10.19.37.158:15440          10.19.37.43:27017           ESTABLISHED
tcp        0      0 10.19.37.158:12174          10.19.37.43:27017           ESTABLISHED
tcp        0      0 10.19.37.158:1412           10.19.37.96:27017           ESTABLISHED
tcp        0      0 10.19.37.158:39886          10.19.37.96:27017           ESTABLISHED
除了tcp的,udp的连接也是有的,只是这里没截出来。最后一列的LISTEN,ESTABLISHED等表示tcp的连接状态,可以在我转载的这篇文章里了解:http://www.cnblogs.com/doubilaile/p/8082632.html。
只查看tcp的连接:
[ruan.wenwu@kddi-zol-fss-web1 proc]$ netstat -ant
Active Internet connections (servers and established)
Proto Recv-Q Send-Q Local Address               Foreign Address             State
tcp        0      0 0.0.0.0:5666                0.0.0.0:*                   LISTEN
tcp        0      0 0.0.0.0:9000                0.0.0.0:*                   LISTEN
tcp        0      0 0.0.0.0:873                 0.0.0.0:*                   LISTEN
tcp        0      0 0.0.0.0:111                 0.0.0.0:*                   LISTEN
tcp        0      0 0.0.0.0:5200                0.0.0.0:*                   LISTEN
tcp        0      0 0.0.0.0:53                  0.0.0.0:*                   LISTEN
tcp        0      0 0.0.0.0:22                  0.0.0.0:*                   LISTEN
只查看tcp的端口:
[ruan.wenwu@kddi-zol-fss-web1 proc]$ netstat -lntp
(Not all processes could be identified, non-owned process info
 will not be shown, you would have to be root to see it all.)
Active Internet connections (only servers)
Proto Recv-Q Send-Q Local Address               Foreign Address             State       PID/Program name
tcp        0      0 0.0.0.0:5666                0.0.0.0:*                   LISTEN      -
tcp        0      0 0.0.0.0:9000                0.0.0.0:*                   LISTEN      -
tcp        0      0 0.0.0.0:873                 0.0.0.0:*                   LISTEN      -
tcp        0      0 0.0.0.0:111                 0.0.0.0:*                   LISTEN      -
tcp        0      0 0.0.0.0:5200                0.0.0.0:*                   LISTEN      -
tcp        0      0 0.0.0.0:53                  0.0.0.0:*                   LISTEN      -
tcp        0      0 0.0.0.0:22                  0.0.0.0:*                   LISTEN      -
tcp        0      0 127.0.0.1:25                0.0.0.0:*                   LISTEN      -
tcp        0      0 0.0.0.0:443                 0.0.0.0:*                   LISTEN      -
tcp        0      0 :::873                      :::*                        LISTEN      -
tcp        0      0 :::111                      :::*                        LISTEN      -
tcp        0      0 :::80                       :::*                        LISTEN      -
tcp        0      0 :::81                       :::*                        LISTEN      -
tcp        0      0 :::53                       :::*                        LISTEN      -
tcp        0      0 :::22                       :::*                        LISTEN      -
tcp        0      0 :::33270                    :::*
查看当前并发数,以及各种连接状态的数量:
[ruan.wenwu@kddi-zol-fss-web1 proc]$ netstat -an|awk '/^tcp/{++sta[$NF]} END {for(key in sta) print key,"-",sta[key]}'
TIME_WAIT - 201
CLOSE_WAIT - 2
SYN_SENT - 5
ESTABLISHED - 126
LISTEN - 16
三、linux下抓包
什么时候需要抓包呢?比如说我们网站被攻击了,我想知道是哪些请求在访问我。
首先看tcpdump命令,这个命令能实时查看数据流向,还能将数据保存起来。
查看网卡指定网卡的数据流:
[root@iZ25lzba47vZ ruanwenwu]# tcpdump -nn -i eth1
tcpdump: verbose output suppressed, use -v or -vv for full protocol decode
listening on eth1, link-type EN10MB (Ethernet), capture size 65535 bytes
17:45:54.615643 IP 101.200.168.135.22 > 203.130.43.155.3217: Flags [P.], seq 30988674:30988806, ack 2708563650, win 638, length 132
17:45:54.615688 IP 101.200.168.135.22 > 203.130.43.155.3217: Flags [P.], seq 132:184, ack 1, win 638, length 52
17:45:54.615737 IP 101.200.168.135.22 > 203.130.43.155.3217: Flags [P.], seq 184:316, ack 1, win 638, length 132
17:45:54.615780 IP 101.200.168.135.22 > 203.130.43.155.3217: Flags [P.], seq 316:368, ack 1, win 638, length 52
17:45:54.621144 IP 203.130.43.155.3217 > 101.200.168.135.22: Flags [.], ack 184, win 16086, length 0
17:45:54.621315 IP 203.130.43.155.3217 > 101.200.168.135.22: Flags [.], ack 368, win 16425, length 0
如果不用-nn参数的话,就是这样:
[root@iZ25lzba47vZ ruanwenwu]# tcpdump -i eth1
tcpdump: verbose output suppressed, use -v or -vv for full protocol decode
listening on eth1, link-type EN10MB (Ethernet), capture size 65535 bytes
17:47:07.909451 IP iZ25lzba47vZ.ssh > 203.130.43.155-BJ-CNC.unite: Flags [P.], seq 30999094:30999226, ack 2708564638, win 638, length 132
17:47:07.909498 IP iZ25lzba47vZ.ssh > 203.130.43.155-BJ-CNC.unite: Flags [P.], seq 132:184, ack 1, win 638, length 52
17:47:07.909545 IP iZ25lzba47vZ.ssh > 203.130.43.155-BJ-CNC.unite: Flags [P.], seq 184:316, ack 1, win 638, length 132
17:47:07.909596 IP iZ25lzba47vZ.ssh > 203.130.43.155-BJ-CNC.unite: Flags [P.], seq 316:368, ack 1, win 638, length 52
显示的是host名称加端口名称的方式,不便于观看。
还可以指定端口:
[root@iZ25lzba47vZ ruanwenwu]# tcpdump -nn -i eth1 port 80
tcpdump: verbose output suppressed, use -v or -vv for full protocol decode
listening on eth1, link-type EN10MB (Ethernet), capture size 65535 bytes
17:48:58.774223 IP 203.130.43.155.12311 > 101.200.168.135.80: Flags [P.], seq 3665182018:3665182659, ack 1466297217, win 16425, length 641
17:48:58.775710 IP 203.130.43.155.12313 > 101.200.168.135.80: Flags [F.], seq 4247810656, ack 669992317, win 16425, length 0
17:48:58.775754 IP 101.200.168.135.80 > 203.130.43.155.12313: Flags [F.], seq 1, ack 1, win 115, length 0
17:48:58.780185 IP 203.130.43.155.12313 > 101.200.168.135.80: Flags [.], ack 2, win 16425, length 0
17:48:58.813963 IP 101.200.168.135.80 > 203.130.43.155.12311: Flags [.], ack 641, win 151, length 0
更加复杂的组合:
tcpdump: verbose output suppressed, use -v or -vv for full protocol decode
listening on eth1, link-type EN10MB (Ethernet), capture size 65535 bytes
17:52:02.211034 IP 203.130.43.155.12311 > 101.200.168.135.80: Flags [P.], seq 3665186730:3665187425, ack 1466544476, win 47815, length 695
17:52:02.248711 IP 101.200.168.135.80 > 203.130.43.155.12311: Flags [.], seq 1:2921, ack 695, win 227, length 2920
17:52:02.248734 IP 101.200.168.135.80 > 203.130.43.155.12311: Flags [.], seq 2921:4381, ack 695, win 227, length 1460
17:52:02.248738 IP 101.200.168.135.80 > 203.130.43.155.12311: Flags [P.], seq 4381:5203, ack 695, win 227, length 822
17:52:02.252921 IP 203.130.43.155.12311 > 101.200.168.135.80: Flags [.], ack 5203, win 47815, length 0
将捕捉的数据流存储:
[root@iZ25lzba47vZ ruanwenwu]# tcpdump -nn -i eth1 port 80 -c 100 -w 1.cap
tcpdump: listening on eth1, link-type EN10MB (Ethernet), capture size 65535 bytes
100 packets captured
117 packets received by filter
0 packets dropped by kernel
保存的文件:
[root@iZ25lzba47vZ ruanwenwu]# ls
1.cap  test
查看保存的文件:
[root@iZ25lzba47vZ ruanwenwu]# tcpdump -r 1.cap
reading from file 1.cap, link-type EN10MB (Ethernet)
17:53:40.417395 IP 140.205.201.36.60799 > iZ25lzba47vZ.http: Flags [S], seq 489097582, win 14600, options [mss 1460,sackOK,TS val 1468276649 ecr 0,nop,wscale 7], length 0
17:53:40.417427 IP iZ25lzba47vZ.http > 140.205.201.36.60799: Flags [S.], seq 2281729630, ack 489097583, win 14600, options [mss 1460,nop,nop,sackOK,nop,wscale 7], length 0
但是这样还是很不适合观看,下面我们介绍一种比较好看的工具wireshark中的tshark命名。
安装:
yum -y isntall wireshark
使用tshark捕捉请求:
[root@iZ25lzba47vZ ruanwenwu]# tshark -i eth1 -n -t a -R http.request -T fields -e "frame.time" -e "ip.src" -e "http.ho
> st" -e "http.request.method" -e "http.request.uri"
tshark: -R without -2 is deprecated. For single-pass filtering use -Y.
Running as user "root" and group "root". This could be dangerous.
Capturing on 'eth1'
"Dec 22, 2017 17:57:56.515164825 CST"    101.226.66.187        GET    /Public/js/smartresize.js?v=0.0.0
"Dec 22, 2017 17:57:56.803786084 CST"    101.226.33.203        GET    /Public/js/smartresize.js?v=0.0.0
"Dec 22, 2017 17:57:57.656091795 CST"    203.130.43.155        GET    /
"Dec 22, 2017 17:57:58.722506079 CST"    203.130.43.155        GET    /blog/162.html
"Dec 22, 2017 17:57:59.963869732 CST"    203.130.43.155        GET    /
"Dec 22, 2017 17:58:01.593208218 CST"    203.130.43.155        GET    /blog/159.html
"Dec 22, 2017 17:58:02.958777018 CST"    203.130.43.155        GET    /
"Dec 22, 2017 17:58:04.106209332 CST"    203.130.43.155        GET    /blog/157.html
"Dec 22, 2017 17:58:06.556259345 CST"    101.226.33.203        GET    /Public/js/detail.js?jack
"Dec 22, 2017 17:58:08.152255201 CST"    101.226.66.187        GET    /Public/js/detail.js?jack
看到没有,非常直观。
四、Linux网络相关
这一部分会讲到网卡的关闭和启动。然后就是虚拟网卡的配置,修改主机host。
启动:
ifup eth1
停止:
ifdown eth1
如果远程操作的话,不能ifdown,否则就连不上了。如果真要ifdown,需要这样使用:
ifdown eth1 && ifup eth1
设置虚拟网卡:
后期我们学到lvs和keepalived时会用到这个虚拟网卡。我们先了解一下它是如何配置的。
首先复制一块网卡:
[root@iZ25lzba47vZ network-scripts]# cp ifcfg-eth1 ifcfg-eth1:0
[root@iZ25lzba47vZ network-scripts]# ls
ifcfg-eth0    ifdown-bnep  ifdown-post    ifdown-TeamPort  ifup-eth   ifup-plusb   ifup-Team         network-functions
ifcfg-eth1    ifdown-eth   ifdown-ppp     ifdown-tunnel    ifup-ippp  ifup-post    ifup-TeamPort     network-functions-ipv6
ifcfg-eth1:0  ifdown-ippp  ifdown-routes  ifup             ifup-ipv6  ifup-ppp     ifup-tunnel       route-eth0
ifcfg-lo      ifdown-ipv6  ifdown-sit     ifup-aliases     ifup-isdn  ifup-routes  ifup-wireless     route-eth1
ifdown        ifdown-isdn  ifdown-Team    ifup-bnep        ifup-plip  ifup-sit     init.ipv6-global
编辑这块网卡:
vim ifcfg-eth1:0
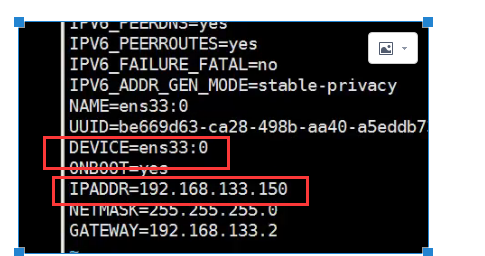
修改DEVICE=ifcfg-eth1:0,IPADDR为你同网段的地址。注意,图文不符。因为我是线上的服务器。
ifup eth1:0就好了:
ifup eth1:0
网卡起来后你就可以ping一下看看了。
配置host:
配置文件地址是/etc/hosts,我们用vim编辑它就能看到:
127.0.0.1 localhost
::1         localhost localhost.localdomain localhost6 localhost6.localdomain6
host的作用是告诉服务器,当这个域名来访问时,我找哪个Ip去解析它。配置的方式很简单,前面是ip,然后加上空格,后面写域名就好了,1个ip可以对应多个域名,用空格连接。