Container Performance Analysis at DockerCon 2017
https://www.slideshare.net/brendangregg/container-performance-analysis
Run Process Debug Tools in Containers, But Install Nothing
https://dzone.com/articles/run-process-debug-tools-in-containers-but-install
This article will explain you how to measure the execution time of docker container.
Execution time of docker container can divided into three phase:
- Docker creation time
This is the time taken to boot up the docker and make the OS ready to execute our code. - Docker startup time
This is the time taken to execute our code inside docker. - Docker finish time
Time taken to finish the code for execution of docker.
Let’s pull the alpine docker to measure the execution time.
docker pull alpine
Time of execution can be measured in two ways:
- Using Ubuntu inbuilt time method
time docker run --rm --name=test alpine ping -c 10 8.8.8.8

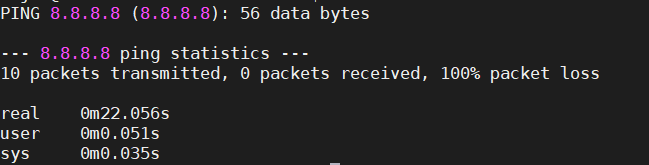
Execution time is the sum of real, user, sys
2. Using docker container inspect
docker run --name=test alpine ping -c 10 8.8.8.8
Let’s run inspect command
docker container inspect test
We get output as
[
    {
        "Id": "5378bdbc462a40ea9ebb29a621636f3714dce93e9f1bdc763105ec018f78b41e",
        "Created": "2020-01-22T06:43:37.638083294Z",
        "Path": "ping",
        "Args": [
            "-c",
            "10",
            "8.8.8.8"
        ],
        "State": {
            "Status": "exited",
            "Running": false,
            "Paused": false,
            "Restarting": false,
            "OOMKilled": false,
            "Dead": false,
            "Pid": 0,
            "ExitCode": 1,
            "Error": "",
            "StartedAt": "2020-01-22T06:43:39.375766823Z",
            "FinishedAt": "2020-01-22T06:43:58.381392582Z"
        },
We get the created time
"Created": "2020-01-22T06:43:37.638083294Z"
we get the start time
"StartedAt": "2020-01-22T06:43:39.375766823Z"
We get the finished time
"FinishedAt": "2020-01-22T06:43:58.381392582Z"
We can easily calculate execution time.
root@cloud:~/hyper/cloud-hypervisor# strace -c -f -S name  docker run --rm -itd  --name=kata-test  --runtime kata-runtime busybox
strace: Process 21490 attached
strace: Process 21491 attached
strace: Process 21492 attached
strace: Process 21493 attached
strace: Process 21494 attached
strace: Process 21495 attached
strace: Process 21496 attached
strace: Process 21497 attached
strace: Process 21498 attached
strace: Process 21499 attached
strace: Process 21500 attached
strace: Process 21501 attached
strace: Process 21502 attached
strace: Process 21503 attached
strace: Process 21504 attached
strace: Process 21505 attached
strace: Process 21506 attached
strace: Process 21507 attached
87130c9c40a85446fb67d21a2704be785f284e8e53eb0cffa051f38a862e97b9
strace: Process 21513 attached
% time     seconds  usecs/call     calls    errors syscall
------ ----------- ----------- --------- --------- ----------------
  0.00    0.000014           5         3           brk
  0.00    0.000000           0         1           capget
  6.12    0.019506          24       810           clock_gettime
  0.08    0.000263          14        19           clone
  0.03    0.000094           5        19           close
  0.02    0.000052          13         4         2 connect
  0.00    0.000013          13         1           epoll_create1
  0.01    0.000016           2         8           epoll_ctl
  3.44    0.010972         229        48           epoll_pwait
  0.00    0.000000           0         1           execve
  0.01    0.000042           5         9         9 faccessat
  0.01    0.000034           4         9           fcntl
  0.02    0.000057           5        12           fstat
 80.76    0.257279         220      1172       109 futex
  0.00    0.000000           0         2           getpeername
  0.01    0.000019          10         2           getpid
  0.00    0.000000           0         1           getrandom
  0.00    0.000000           0         2           getsockname
  0.04    0.000112           6        20           gettid
  0.00    0.000000           0         1           gettimeofday
  0.00    0.000011          11         1           getuid
  0.00    0.000000           0         2           ioctl
  0.00    0.000000           0         2           lseek
  0.19    0.000600           7        90           madvise
  0.19    0.000595           8        79           mmap
  0.16    0.000524          10        54           mprotect
  0.06    0.000207          12        17           munmap
  7.69    0.024495          67       366           nanosleep
  0.01    0.000031           1        36        34 newfstatat
  0.05    0.000163          10        17           openat
  0.00    0.000008           8         1           prlimit64
  0.11    0.000351          14        26         6 read
  0.02    0.000055          55         1           readlinkat
  0.04    0.000121           1       128           rt_sigaction
  0.51    0.001629          10       165           rt_sigprocmask
  0.00    0.000007           7         1           sched_getaffinity
  0.24    0.000779           5       146           sched_yield
  0.03    0.000110           6        20           set_robust_list
  0.00    0.000006           6         1           set_tid_address
  0.00    0.000000           0         2           setsockopt
  0.09    0.000297           7        40           sigaltstack
  0.02    0.000062          16         4           socket
  0.00    0.000014          14         1           uname
  0.01    0.000040           8         5           write
------ ----------- ----------- --------- --------- ----------------
100.00    0.318578                  3349       160 total
root@cloud:~/hyper/cloud-hypervisor#
https://stackoverflow.com/questions/60840320/docker-50-performance-hit-on-cpu-intensive-code