以下操作在CENTOS7环境。
使用prometheus做监控,使用grafana做dashboard的界面展示:
因prometheus自带的监控web界面图形化展示方面比较弱,推荐使用grafana集成prometheus展示;
一、软件安装
1)granafa的安装:
官方安装指南:https://grafana.com/grafana/download?platform=linux
wget https://s3-us-west-2.amazonaws.com/grafana-releases/release/grafana-5.2.2-1.x86_64.rpm
sudo yum localinstall grafana-5.2.2-1.x86_64.rpm
service grafana-server start
2)prometheus的安装:
官方下载地址:https://prometheus.io/download/
安装prometheus主程序
wget https://github.com/prometheus/prometheus/releases/download/v2.3.2/prometheus-2.3.2.linux-amd64.tar.gz
tar -zxvf prometheus-2.3.2.linux-amd64.tar.gz -C /usr/local/prometheus
cd /usr/local/prometheus
nohup ./prometheus >/dev/null &
安装 prometheus的告警程序
wget https://github.com/prometheus/alertmanager/releases/download/v0.15.2/alertmanager-0.15.2.linux-amd64.tar.gz
tar -zxvf alertmanager-0.15.2.linux-amd64.tar.gz -C /usr/local/prometheus
cd /usr/local/prometheus
nohup ./alertmanager >/dev/null &
3)需在各监控节点安装prometheus的node程序;
wget https://github.com/prometheus/node_exporter/releases/download/v0.16.0/node_exporter-0.16.0.linux-amd64.tar.gz
tar -zxvf node_exporter-0.16.0.linux-amd64.tar.gz -C /usr/local/prometheus
cd /usr/local/prometheus
nohup ./node_exporter >/dev/null &
二、安装exporter
prometheus可以理解为一个数据库+数据抓取工具,工具从各处抓来统一的数据,放入prometheus这一个时间序列数据库中。那如何保证各处的数据格式是统一的呢?就是通过这个exporter。exporter也是用GO写的程序,它开放一个http接口,对外提供格式化的数据。所以在不同的环境下,需要编写不同的exporter。好在已经有很多写好的exporter,我们可以直接使用,(本句是一句废话为了更好的排版显示)(https://github.com/prometheus这里可以找到很多exporter)我们这里直接使用mysqld_exporter(prometheus.io/download/#mysqld_exporter)。当然也要下载对应系统的版本。
2.1、mysql
解压后的内容如下:
wget https://github.com/prometheus/mysqld_exporter/releases/download/v0.11.0/mysqld_exporter-0.11.0.linux-amd64.tar.gz
tar -zxvf mysqld_exporter-0.11.0.linux-amd64.tar.gz -C /usr/local/prometheus
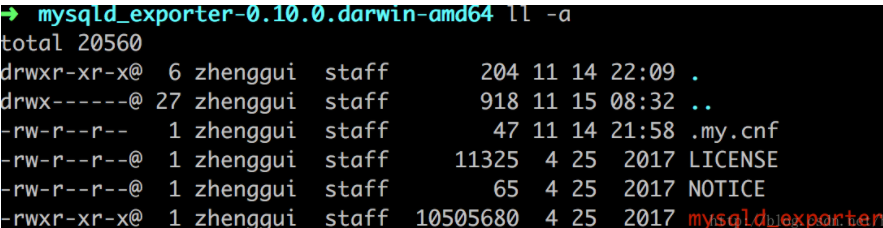
这里的mysqld_exporter是启动文件,.my.cnf是配置文件。想要正确的导出mysql的状态数据,必须在配置文件中正确的配置mysql的连接信息。我的配置如下:
配置.my.cnf文件
[client]
host = 127.0.0.1
user = REPL
password = Pbu4@123
socket = /mysqldata/data/mysqld.sock
[mysqladmin]
host = 127.0.0.1
user = zabbix
password = Zabbix@123
socket = /mysqldata/data/mysqld.sock
nohup ./mysqld_exporter --config.my-cnf=/etc/zabbix/.my.cnf --collect.binlog_size --collect.info_schema.processlist --collect.info_schema.innodb_metrics --collect.engine_innodb_status --collect.perf_schema.file_events --collect.perf_schema.eventswaits --collect.perf_schema.indexiowaits --collect.perf_schema.tableiowaits --collect.info_schema.tables --collect.info_schema.tablestats --collect.auto_increment.columns --collect.info_schema.userstats --collect.info_schema.innodb_cmp --collect.info_schema.innodb_cmpmem --collect.perf_schema.replication_group_member_stats >/dev/null &
可到grafana下载percona APP dashboard.
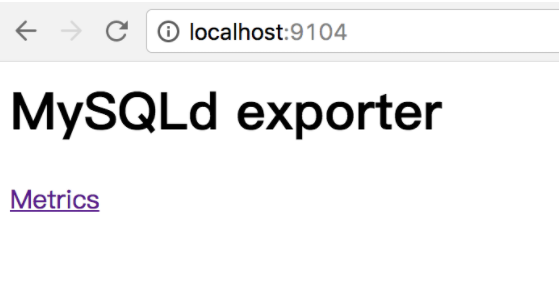
配置好了,就可以启动了。成功如下所示:
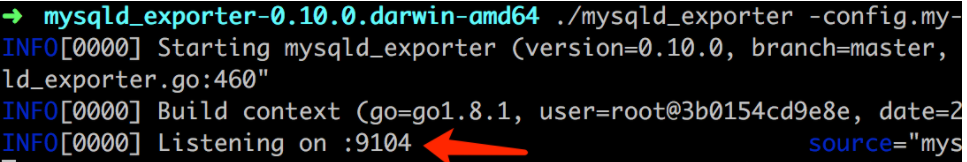
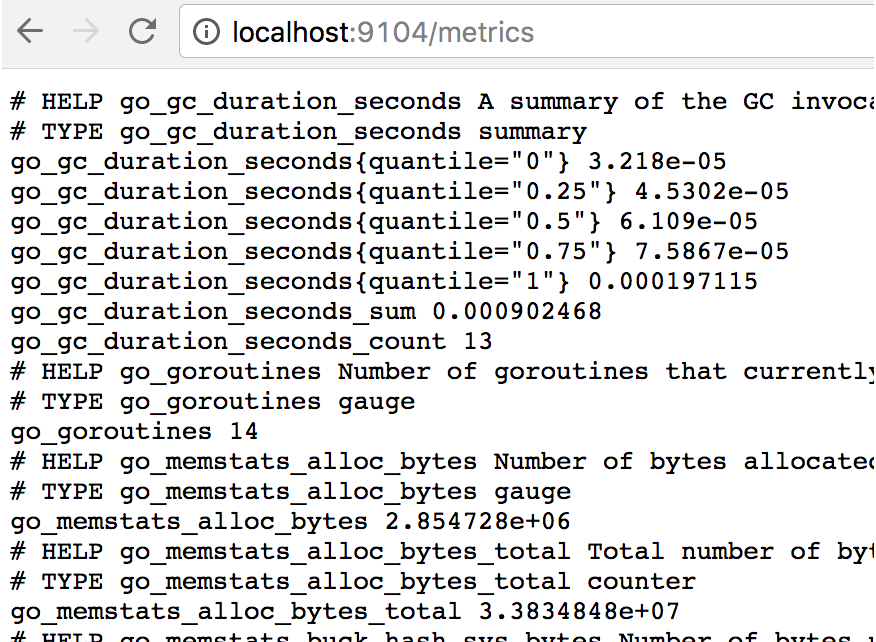
通过localhost:9104,就可以看到exporter导出的数据了:
在Prometheus中配置mysqld_exporter
exporter启动了,需要在Prometheus中正确的配置。修改prometheus目录中的prometheus.yml,增加配置如下:
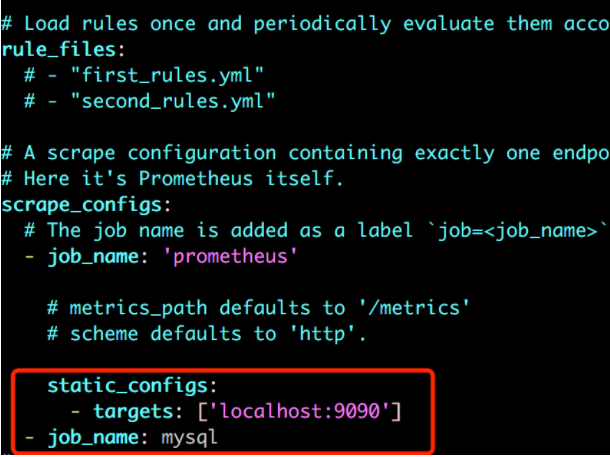
重启prometheus,点击导航栏中的status->targets可以看到,mysql的exporter已经集成进来了。 如下图:
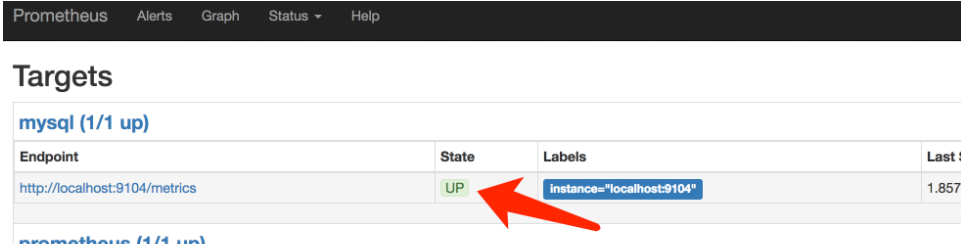
至此,prometheus这边监控mysql的环境搭建基本完成了。
2.2、mongodb的插件安装:
wget https://github.com/dcu/mongodb_exporter/releases/download/v1.0.0/mongodb_exporter-linux-amd64
tar -zxvf mongodb_exporter-linux-amd64 -C /usr/local/prometheus
cd /usr/local/prometheus
mongod配置副本集启动
./mongodb_exporter -mongodb.uri mongodb://192.168.152.128:27017,192.168.152.128:27018,192.168.152.128:27019
mongodb配置单机启动
/mongodb_exporter -mongodb.uri mongodb://192.168.152.128:27017
2.3、redis的插件安装:
redis 在redis服务器安装node_exporter和redis_exporter。
wget https://github.com/oliver006/redis_exporter/releases/download/v0.10.8/redis_exporter-v0.10.8.linux-amd64.tar.gz

wget https://github.com/prometheus/node_exporter/releases/download/0.13.0/node_exporter-0.13.0.linux-amd64.tar.gz


tar -zxvf node_exporter-0.13.0.linux-amd64.tar.gz -C /opt/prometheus_exporters --strip-components=1
tar -zxvf redis_exporter-v0.10.8.linux-amd64.tar.gz -C /opt/prometheus_exporters --strip-components=1
启动
nohup /opt/prometheus_exporters/node_exporter &
nohup /opt/prometheus_exporters/redis_exporter redis//192.168.0.17:6379 &

配置prometheus.yml 加入
- job_name: redis_exporter
  static_configs:
  - targets: ['192.168.0.17:9121']
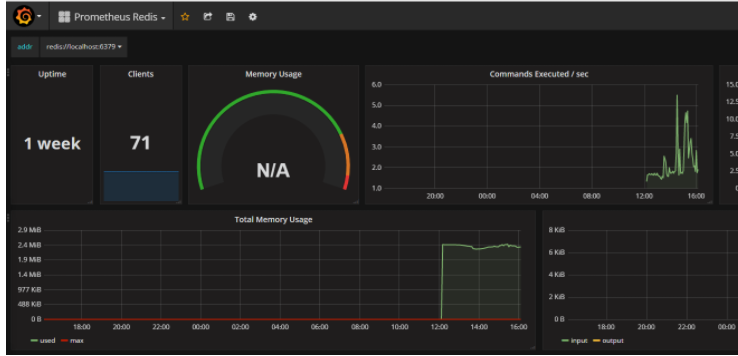
下载grafana的redis的prometheus-redis_rev1.json模板
wget https://grafana.com/api/dashboards/763/revisions/1/download
在grafana中导入json模板
2.4、nginx的插件安装:
下载源码nginx,再下载nginx-module-vts moudle进行编译安装。
git clone git://github.com/vozlt/nginx-module-vts.git
./configure --user=www --group=www --prefix=/usr/local/nginx --with-http_sysguard_module --with-stream --add-module=nginx-module-vts
make &&make install
更改Nginx Conf的配置,添加监控接口/status/:
http {
vhost_traffic_status_zone;
vhost_traffic_status_filter_by_host on;
...
server {
...
location /status {
vhost_traffic_status_display;
vhost_traffic_status_display_format html;
}
}
}
2.5、jmx的插件安装:
注意只对Oracle原生的jdk的相关指标可监控,openjdk的只能监控部分指标。
wget https://repo1.maven.org/maven2/io/prometheus/jmx/jmx_prometheus_javaagent/0.3.1/jmx_prometheus_javaagent-0.3.1.jar
tar -zxvf jmx_prometheus_javaagent-0.3.1.jar
配置config.yml文件
---
startDelaySeconds: 0
hostPort: localhost:58888 #master为本机IP(一般可设置为localhost);1234为想设置的jmx端口(可设置为未被占用的端口)
ssl: false
lowercaseOutputName: false
lowercaseOutputLabelNames: false
启动jar
java -Djava.security.egd=file:/dev/./urandom -javaagent:/var/lib/prometheus/jmx_prometheus_javaagent-0.3.1.jar=9157:/etc/prometheus/config.yml -Dcom.sun.management.jmxremote.ssl=false -Dcom.sun.management.jmxremote.authenticate=false -Dcom.sun.management.jmxremote.port=58888 -Djava.rmi.server.hostname=localhost -jar /app.jar